ASTR 1230 (O'Connell)
STELLAR POPULATIONS AND THE
HISTORY OF THE UNIVERSE
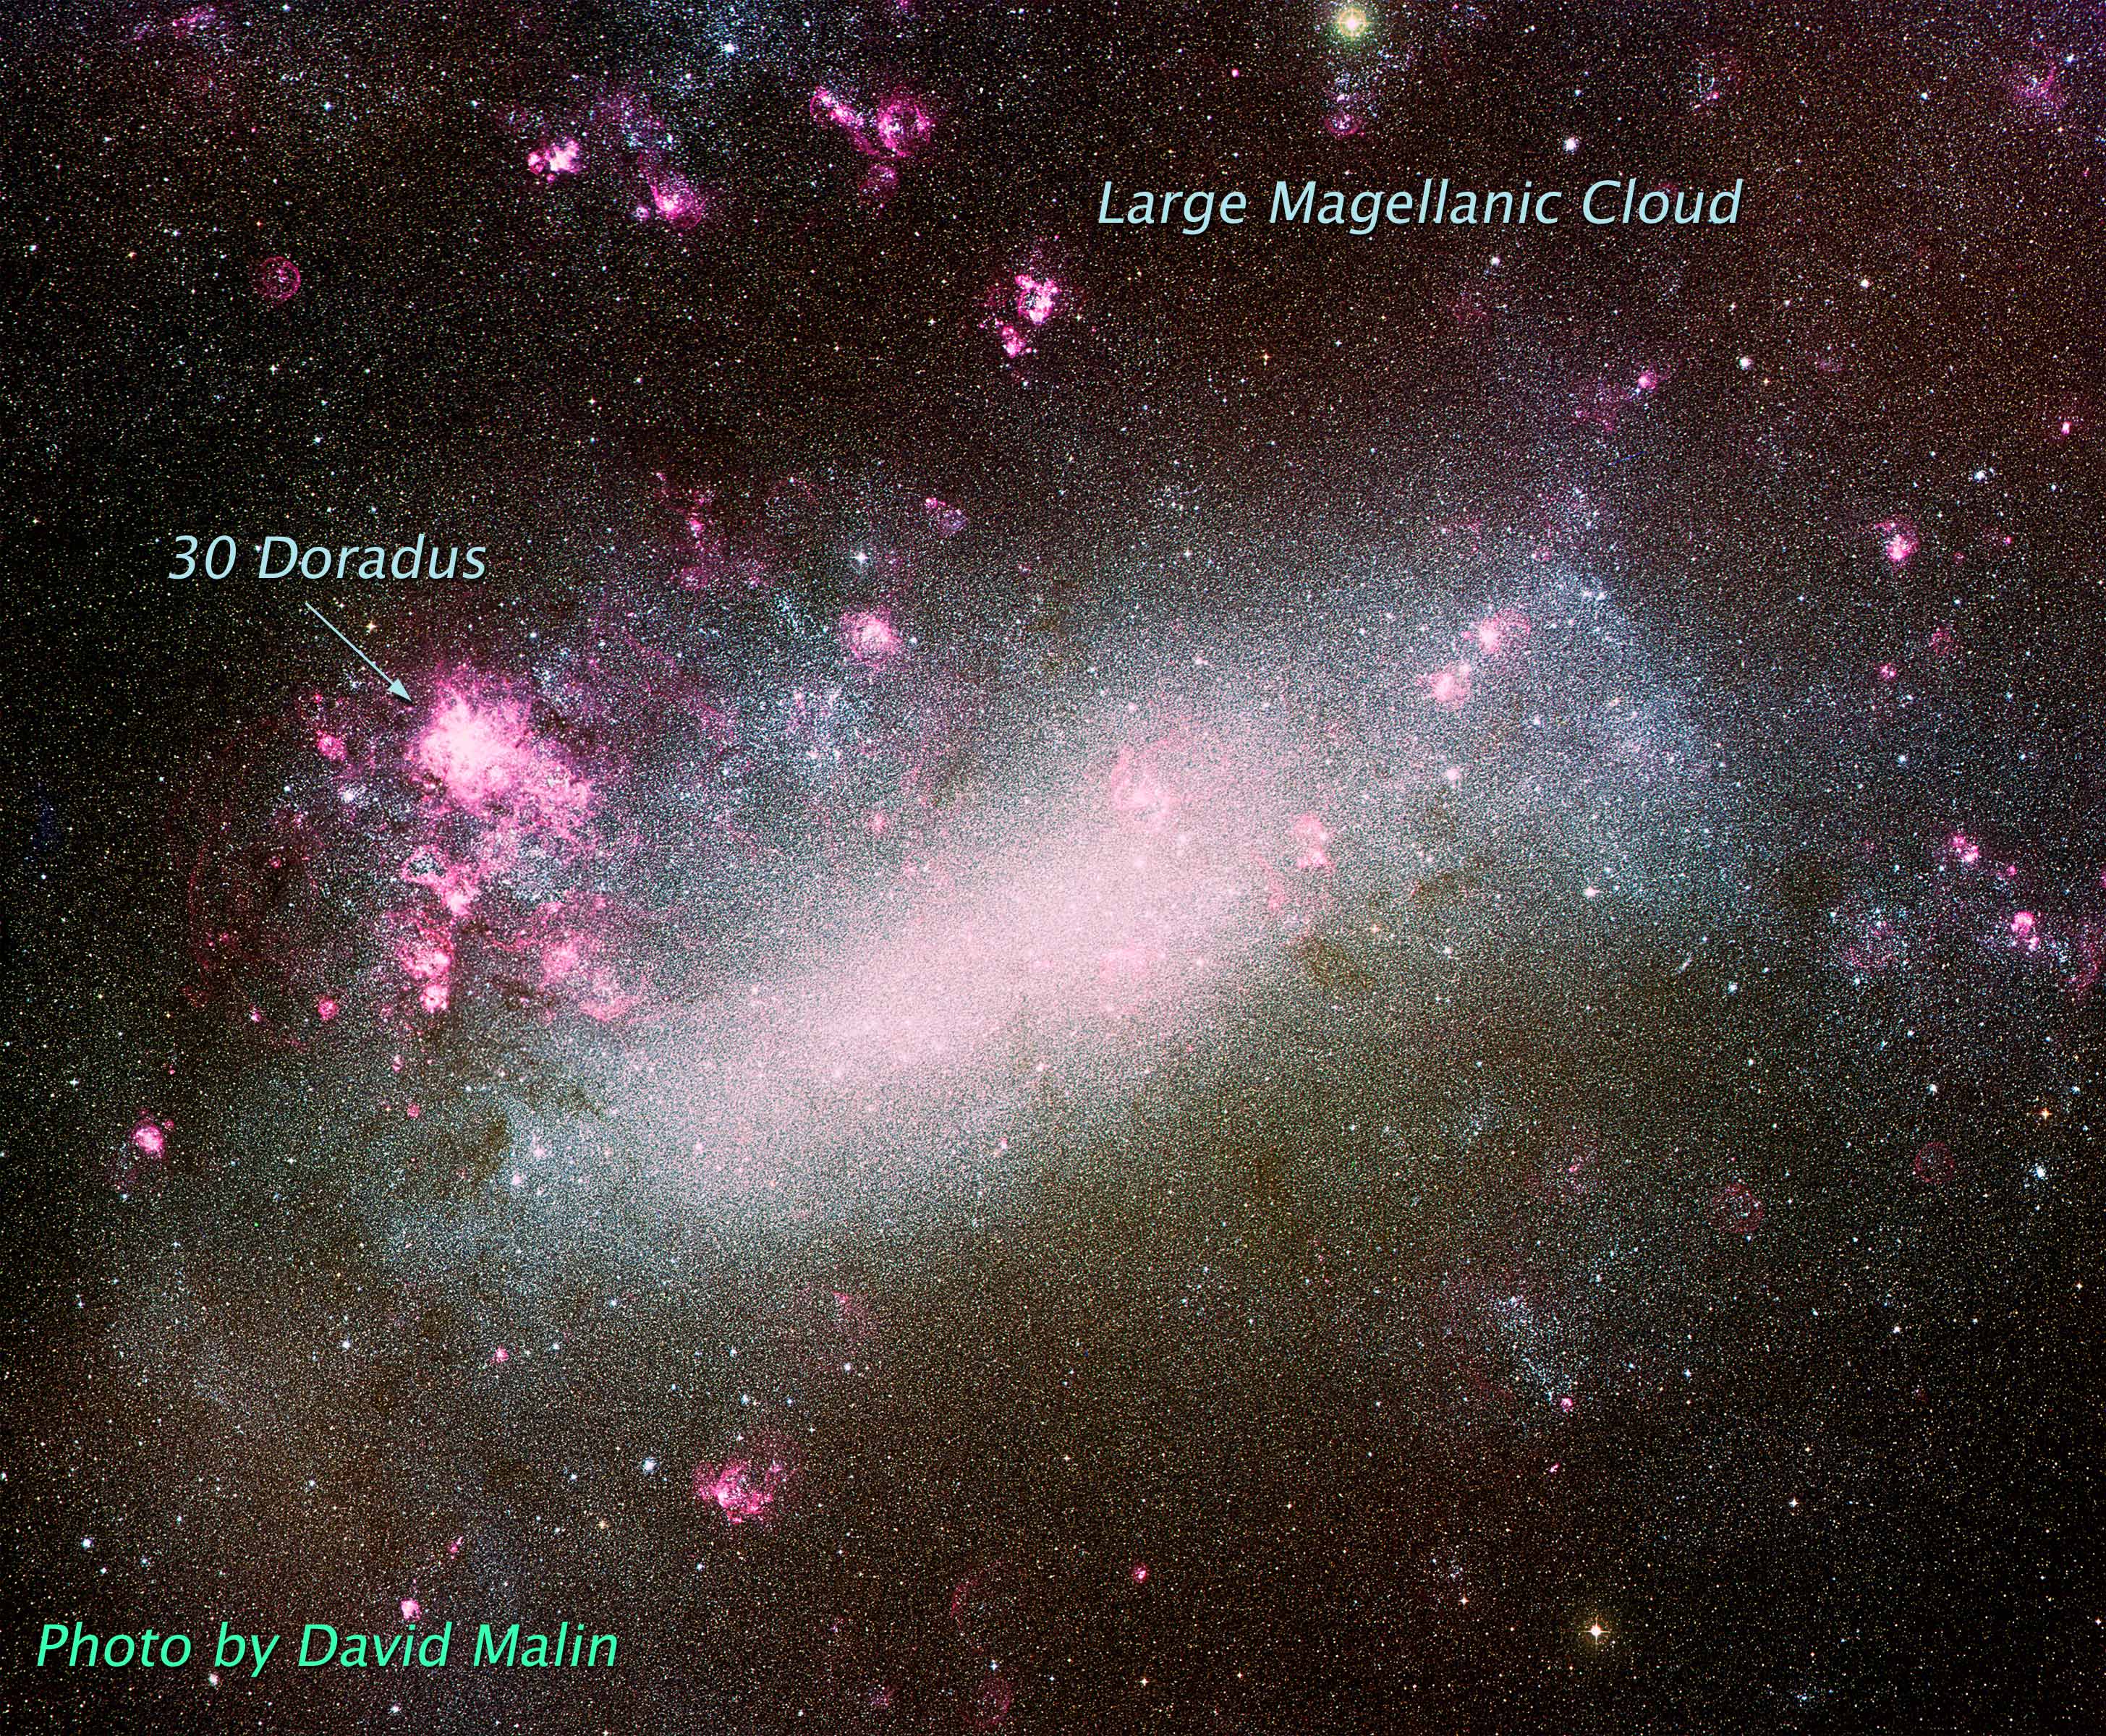
- By studying the properties of the individual stars in a
galaxy
- ...but this is limited only
to nearby galaxies where we can
detect individual stars. At larger distances, individual stars are
too faint and too confused with neighbors to be studied.
- By studying the integrated light (the combined
light output) of the stars in a galaxy
- ...this is less definitive, but we can apply this approach to
any galaxy in the observable universe.
A. MOTIVATION: GALAXIES IN THE DISTANT UNIVERSE
Large telescopes have provided images of thousands of galaxies at distances over 5 billion light years. The Hubble Ultra Deep Field is the best example of a deep galaxy survey -- made by combining many day's worth of exposure time with the Hubble Space Telescope. The extract from the HUDF below shows the strange kinds of galaxies that inhabit the distant universe. Click on the image to see the whole HUDF.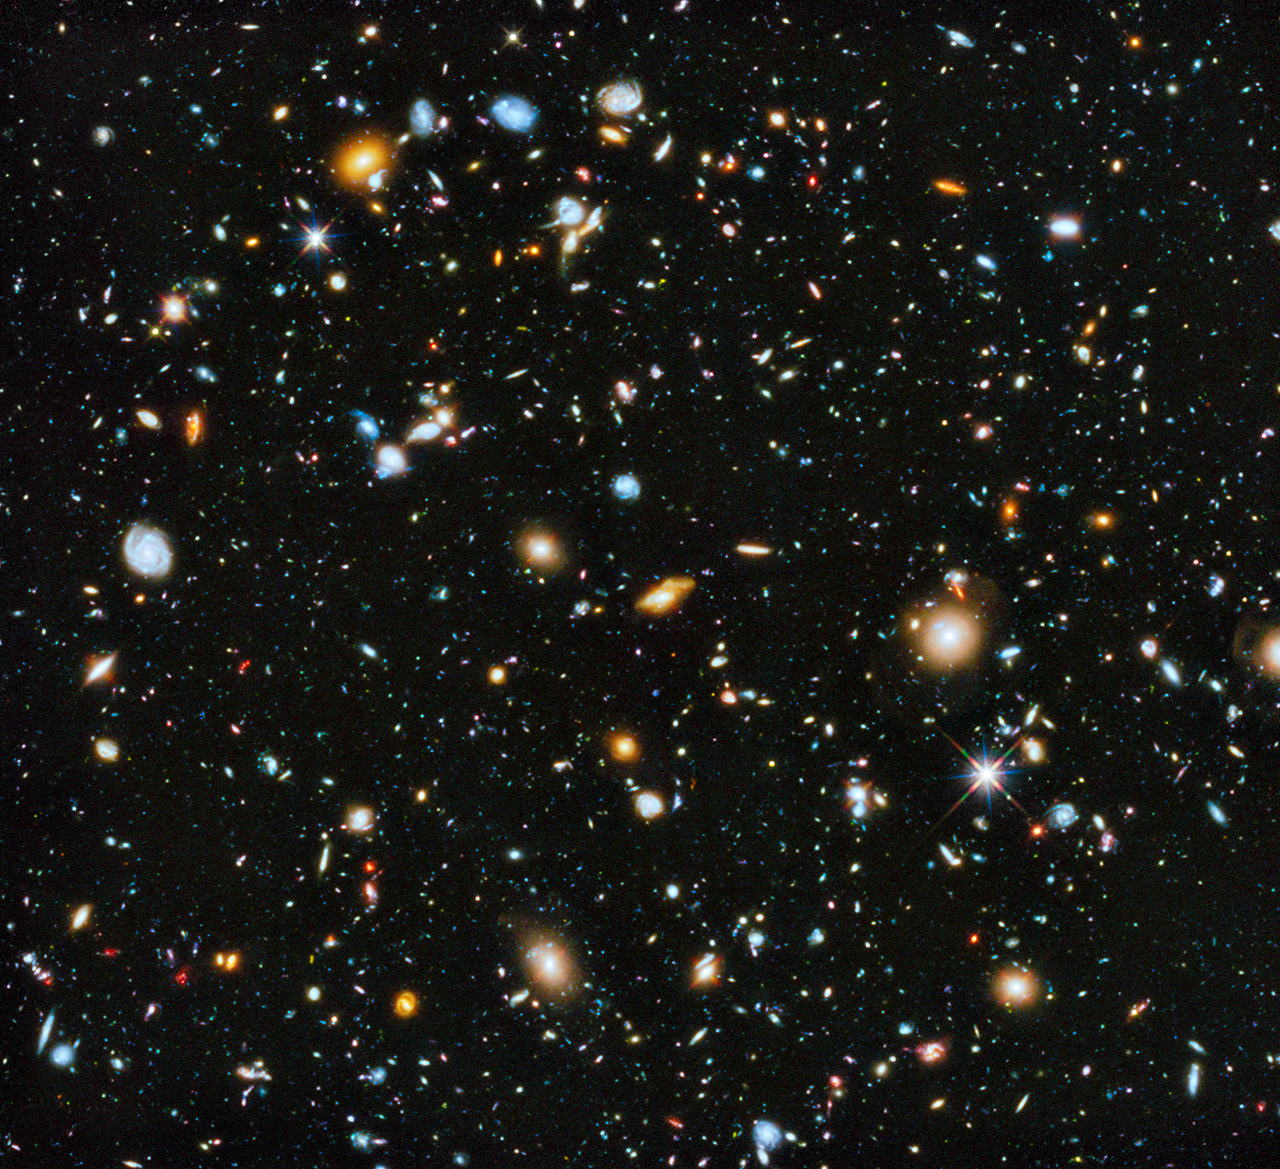
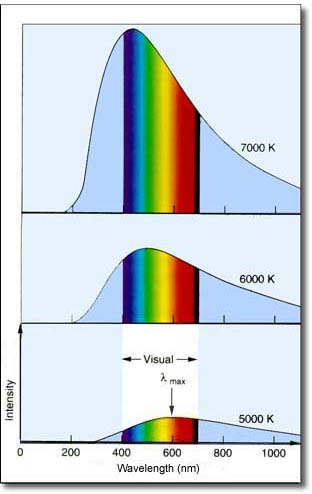
B. THE ELECTROMAGNETIC SPECTRA OF STARS
- Stars radiate mainly in a small region of the EM spectrum: the ultraviolet-optical-infrared region.
- Hotter stars are bluer; they emit more of their light at short EM wavelengths.
- Cooler stars are redder; they emit more of their light at long EM wavelengths.
 |
 |
C. THE EVOLUTION OF STARS
Stars are formed continuously in some galaxies and mainly in bursts in others. In our galaxy the star formation rate (the total mass of gas converted into stars per year) is now about 1 solar mass per year. On the other hand, some starbursts can reach over 1000 solar masses per year. The combined light output of a stellar generation depends on the temperature distribution of its stars and how that changes with age. The Hertzsprung-Russell (HR) diagram is the basic tool for analyzing the temperature distributions of evolving stellar systems.- In the HR diagram, we plot the temperature (increasing to the left) against the instrinsic brightness or luminosity (increasing upward) of individual stars.
- Most stars fall on the main sequence (MS), which runs
diagonally across the HRD. The Sun is an MS star (yellow in the
diagram). More massive stars on the MS are brighter and hotter (hence
bluer).
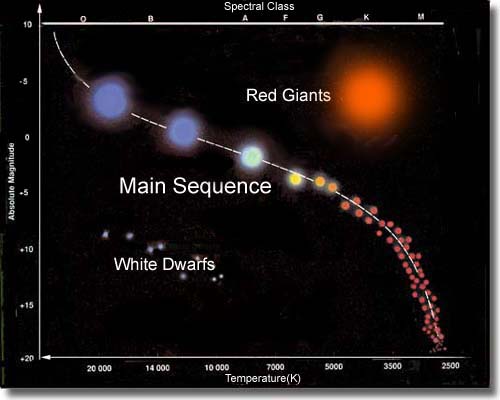
- The main sequence phase of evolution is long-lived. MS stars maintain themselves by burning hydrogen in their cores. For a star like the Sun, that can continue for about 10 billion years because there are huge reserves of hydrogen in all MS stars. But eventually, those run out. When they run out of H fuel, stars evolve off the MS (to the right, or toward lower temperatures, in the diagram). The Sun will move toward the region marked "red giants" in the diagram.
- More massive stars evolve faster. Even though they contain more hydrogen. they burn it much faster than lower mass stars.
- The stars born in a given generation will have a large range in mass. The HR diagram of that generation will change quickly as its more massive stars evolve. Its main sequence will sequentially "burn down" as the generation ages and the most massive stars peel off to cooler temperatures. The mass of the stars near the MS "turnoff" become systematically smaller with age.
- The following animation shows how the distribution of stars in the HR diagram changes with time. Labels by the dots indicate the masses of individual stars (in solar units). The three panels at the right show the structure at a given time of three stars of different mass: 2.6, 1.0, and 0.7 times the solar mass. The age is listed in billions of years. You can see how the mass of the stars at the "turnoff" point decreases in lockstep with the age of the generation.
D. THE INTEGRATED SED/COLOR OF STELLAR POPULATIONS
From the HR diagram for a generation of stars at different ages, we can predict what its combined spectral energy distribution (SED) will be. The SED is simply the distribution of light energy over wavelength, or color in the EM spectrum. To predict the integrated SED of a generation at any time, we simply add up the light of all the stars in the HR diagram, keeping track, of course, of the fact that stars at the top of the diagram are much brighter than those at the bottom. A predicted SED for ages between 10 million years and 15 billion years is shown in the animation below. The HRD of the single generation population is shown in the lower left panel, while its integrated SED is shown for the wavelength range 3000 to 7500 Å in the top panel. The colored regions in the top panel show the responses for three standard "broad-band" filters used by astronomers to determine the colors of stars. The "V" filter corresponds roughly to the response of the human eye. The lower right panel shows how the colors change with time (blue colors in lower left, red in upper right).
- A "young" (less than 100 million years age) population contains massive MS stars. These are hot and generate much blue light. The short wavelength SED even goes off the scale of the plot. Even though they may contain many cool stars, young populations are blue in integrated light
- As age increases, the SED flattens. An "old" (more than 3 billion years age) population contains no massive, hot stars -- only cool low-mass stars on the main sequence and red giants. It is therefore yellow-red in color.
- The sharp dips (or "lines") evident in the integrated SEDs are
produced by absorption by
individual
chemical species -- e.g. atomic hydrogen, calcium, sodium and
iron or molecules like CN and TiO. The abundances of these species
can be determined from the integrated SED.
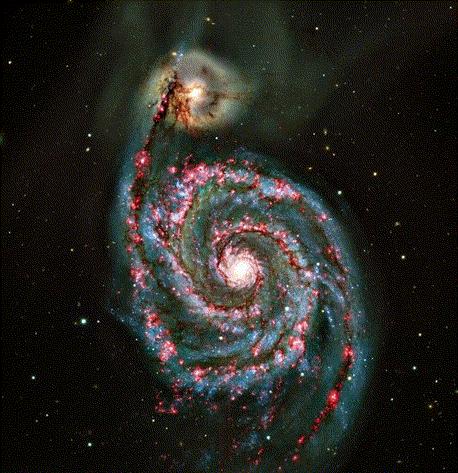
- The hot stars in a "very young" generation (less than 10 million
years age) produce much ionizing radiation in the
extreme ultraviolet region of the SED (not shown). This creates
volumes in the surrounding gas whose spectra contain strong
emission
lines of hydrogen and other ionized gases. We call these "H II"
(meaning "ionized hydrogen") regions. The dominant emission line of
hydrogen (H-alpha) has a deep red color. The combination of this
with the generally blue light of young stars produces a
characteristic pinkish tint in color images of HII regions.
.
-
The image of the "Whirlpool" galaxy (Messier 51) at the right
shows the pink HII regions strung out along the spiral arms.
E. THE STAR FORMATION HISTORY OF THE UNIVERSE
The SED analysis techniques we've described were developed in studies of nearby galaxies. After the amazing images of the distant universe were obtained by the Hubble Space Telescope, those techniques could be applied to the galaxies detected there in wholesale fashion. Before that could be done, it was necessary to correct the SEDs for the effects of the redshift caused by the expansion of the universe. The more distant a galaxy is, the faster it is moving away from us. Because of the Doppler Effect on the spectrum of receding objects, the SED of a distant galaxy is shifted to longer (redder) wavelengths. The amount of the shift, and hence the distance of the galaxy, can be determined by the observed SED, and its colors can then be corrected for the shift. Since 1996 many studies have been made of distant galaxies, using a combination of data from the HST, other space telescopes, and ground-based telescopes. We now have a solid understanding of the gross star formation history of the universe going back over 12 billion years. That's displayed in the diagram below: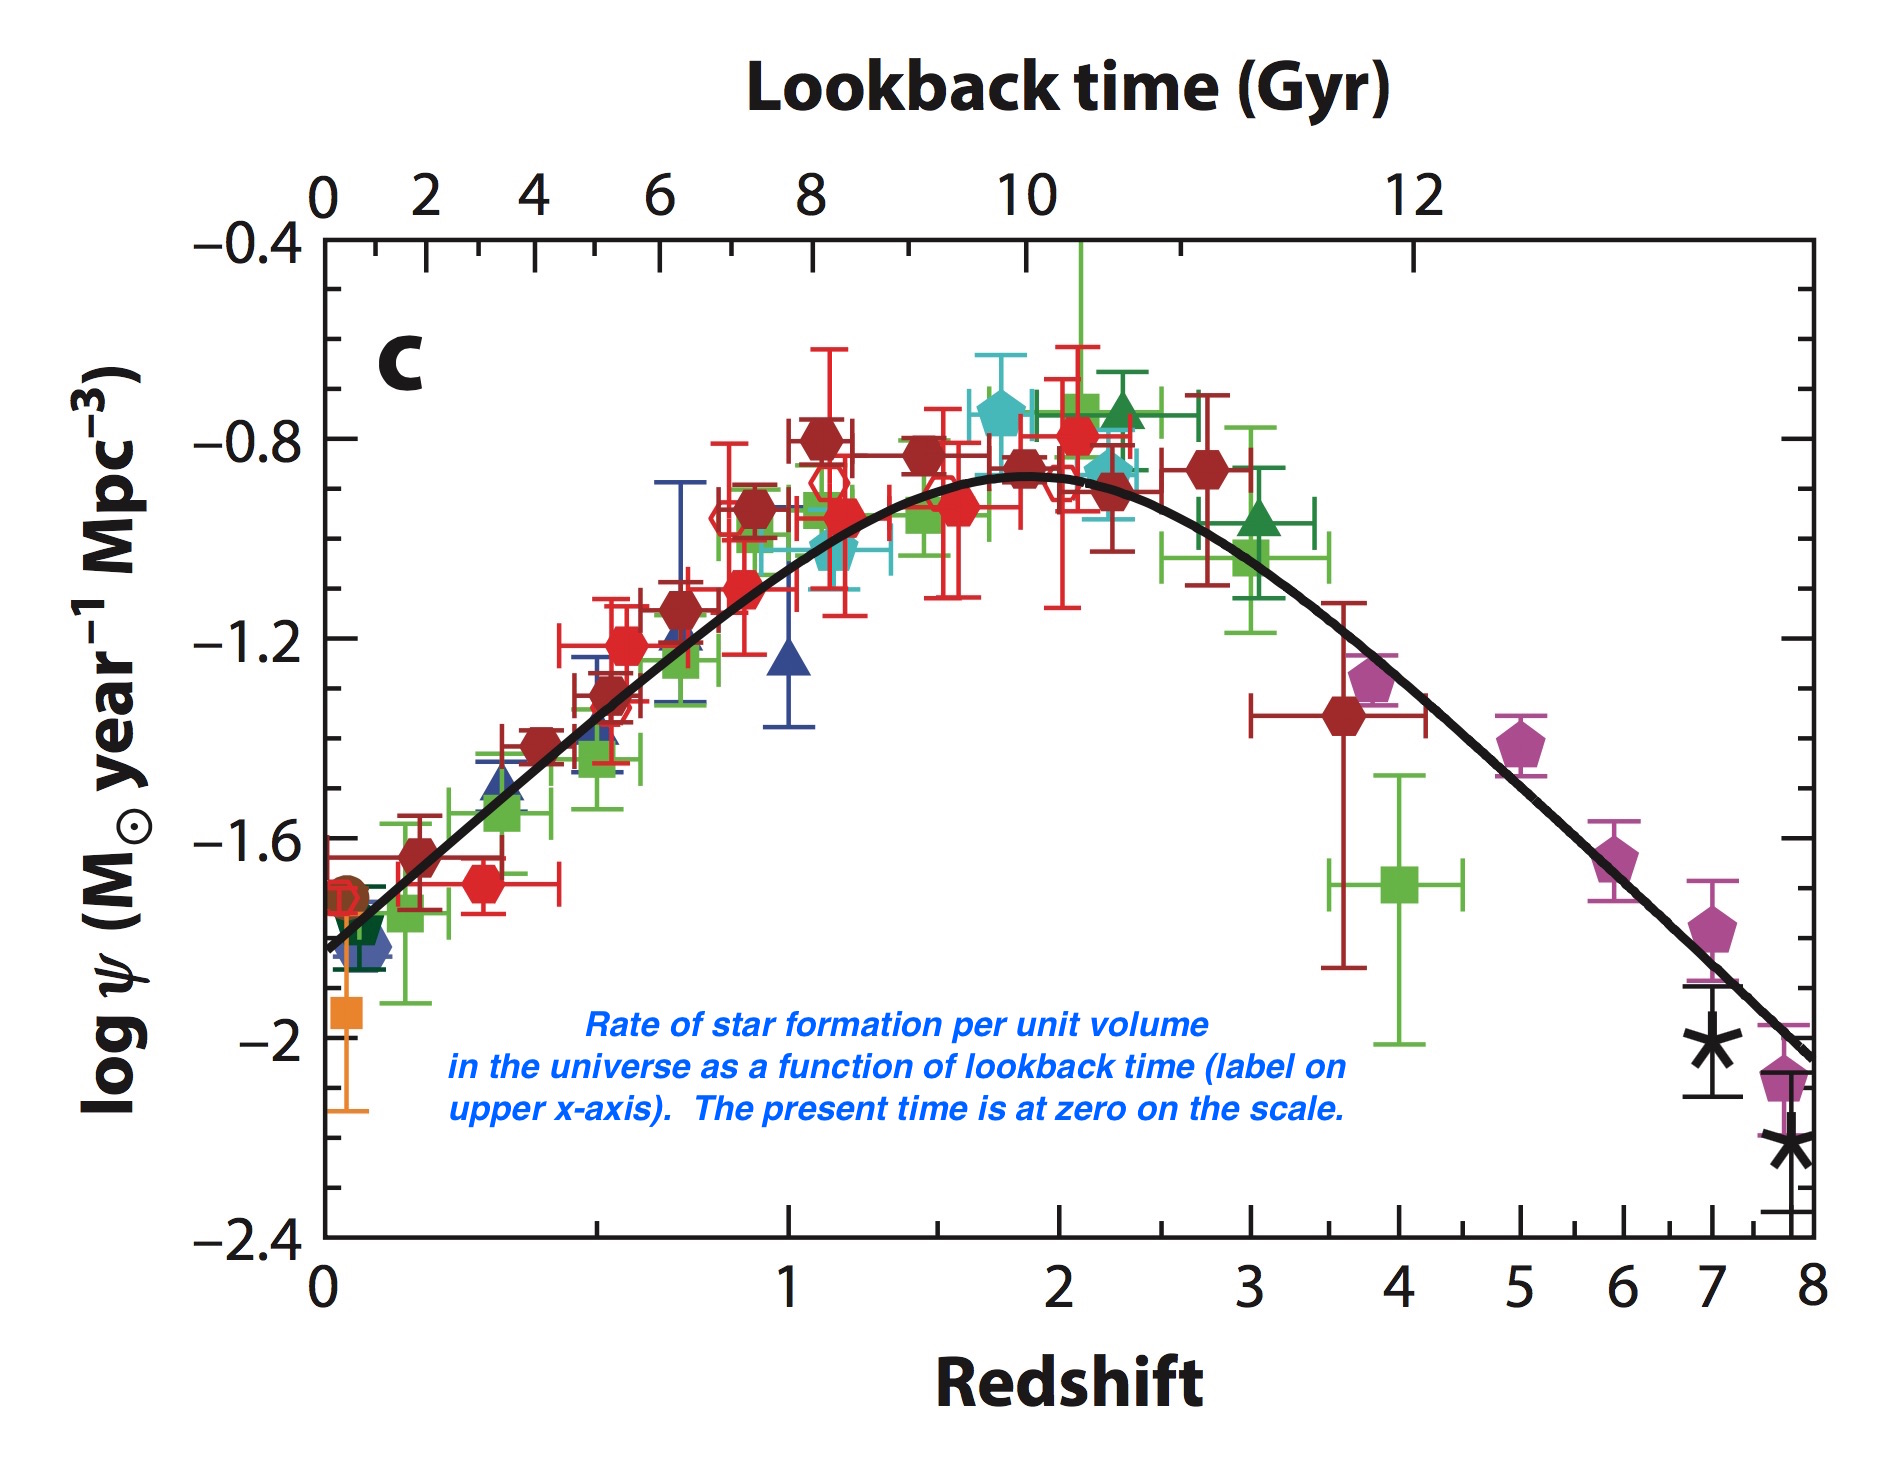
Web Links:
-
Background information on atomic physics and astronomical spectra (ASTR 1210)
Background information on stellar properties and evolution (ASTR 1230)
Information
on the Hubble Deep Fields