ASTR 511 (O'Connell) Lecture Notes
STATE OF THE ART SPECTROSCOPY
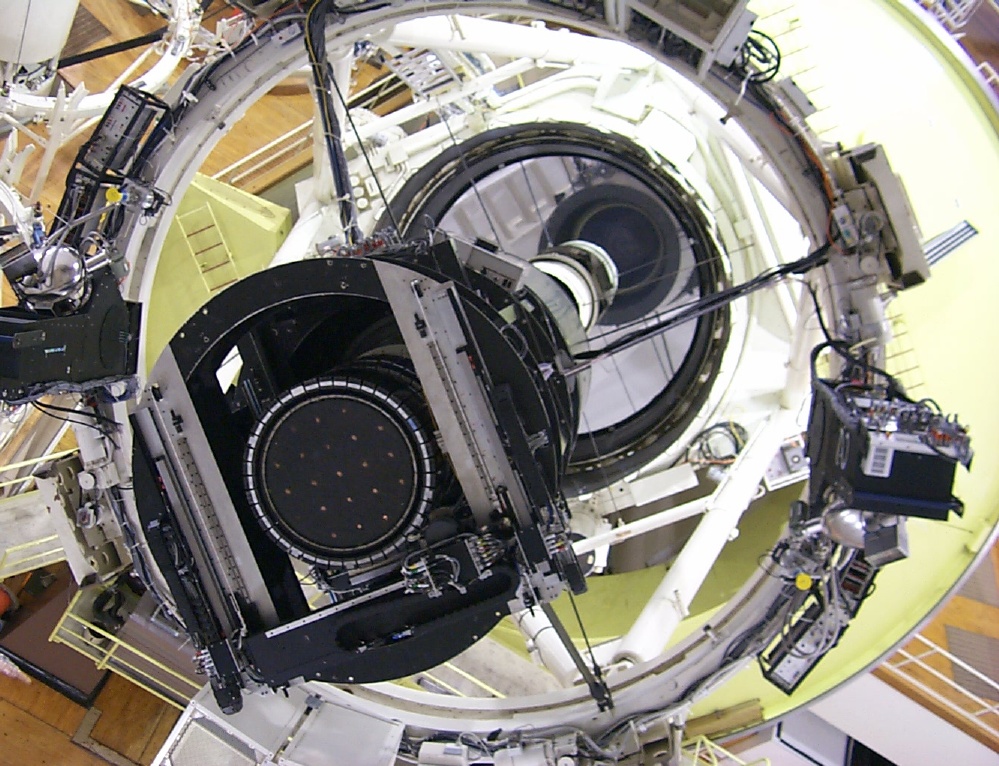
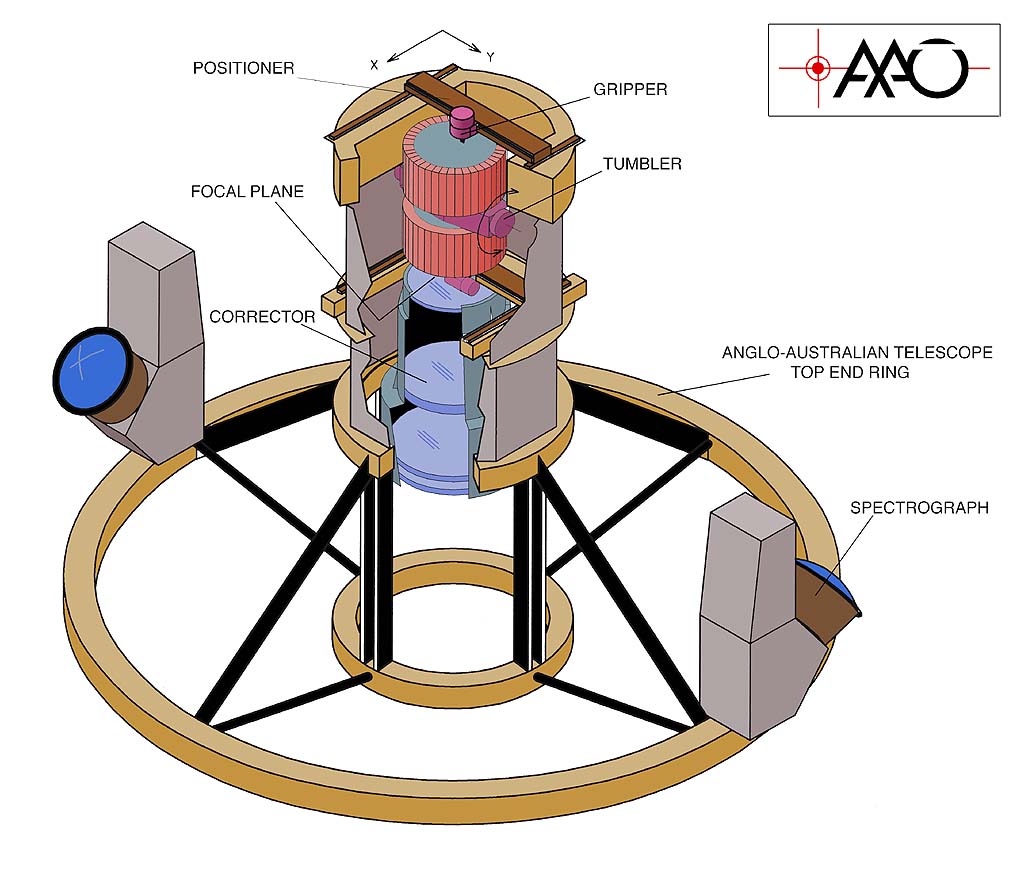
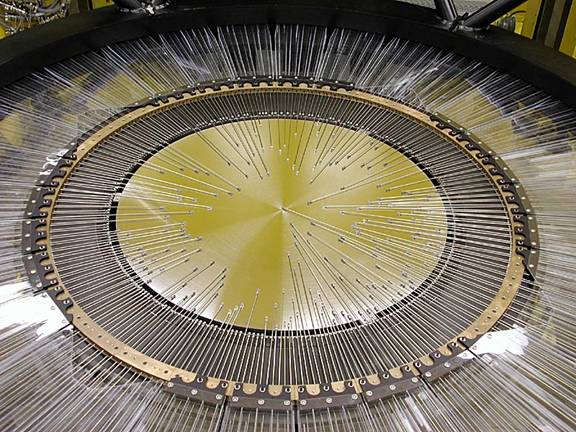
Two Degree Field Fiber-Fed Spectrograph
on the AAT
(J. Pogson)
FIBER-FED MULTI-OBJECT SPECTROGRAPHS
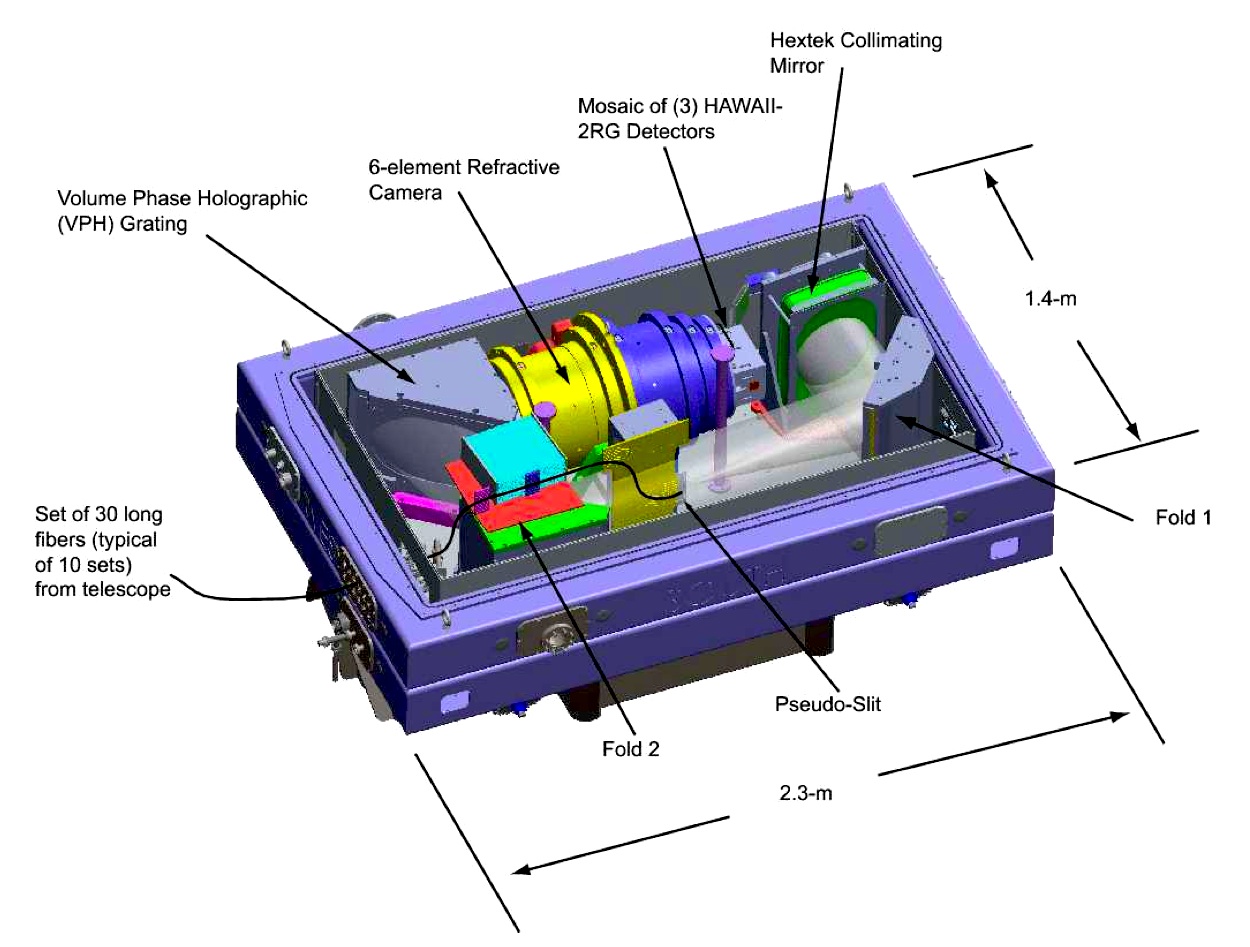
Fiber-fed spectrographs use bundles of optical fibers to transfer light from arbitrary positions in the focal plane to the input of the spectrograph. With care to minimize attenuation, fiber lengths can be up to 10's of meters -- in order to feed a bench spectrograph external to the telescope, for instance. Fiber systems typically offer small (2-4 arcsec) entrance apertures, with a single fiber assigned to each target. There is an "exclusion zone" around each fiber, within which another fiber cannot be placed. Fibers must be repositioned with high precision for each new field. This is usually done by mechanical robots. In most designs, individual fiber apertures are clamped magnetically on a flat focal-plane plate. The Sloan Digital Sky Survey (SDSS) uses specially-drilled "plug plates," into which each fiber is inserted by hand. Output of the fiber unit is usually a linear (slit-like) array at the spectrograph input, yielding a fixed position on the focal plane for each spectrum.- 2dF (AAT 4-m)
-
Prime focus instrument (see
picture at top of page). Two spectrographs with 7 selectable gratings
each for R = 500/2000 observations in the 3700-9000 Å range.
Tektronix 1024x1024 CCD detectors.
2 degree FOV, requiring a large corrector lens; a prism compensator is
used to minimize light loss in fibers due to atmospheric dispersion at
larger zenith angles.
400 fibers per field; magnetically
attached to a field plate; positioned by a robot; 200 to each
spectrograph. Minimum fiber separation 30 arcsec.
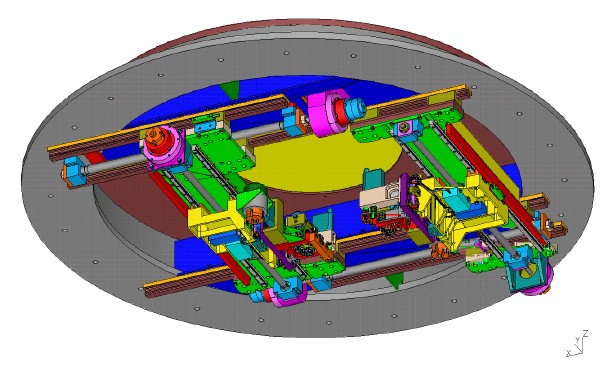
Two fiber focal plane units (one undergoing fiber positioning while other
observes; flip to replace)
|
Hectospec Focal Surface |
|
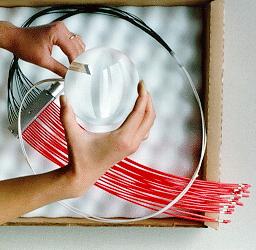
20-fiber cartridge, SDSS |
|
APOGEE Spectrograph |
APERTURE PLATE MULTI-OBJECT SPECTROGRAPHS
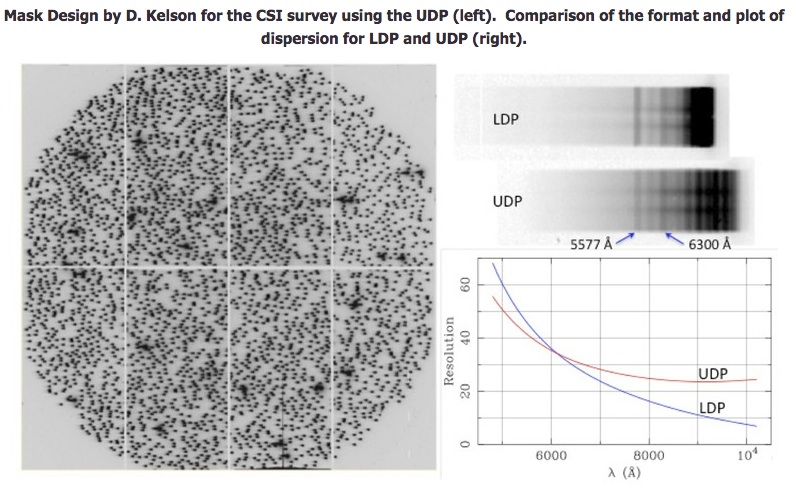
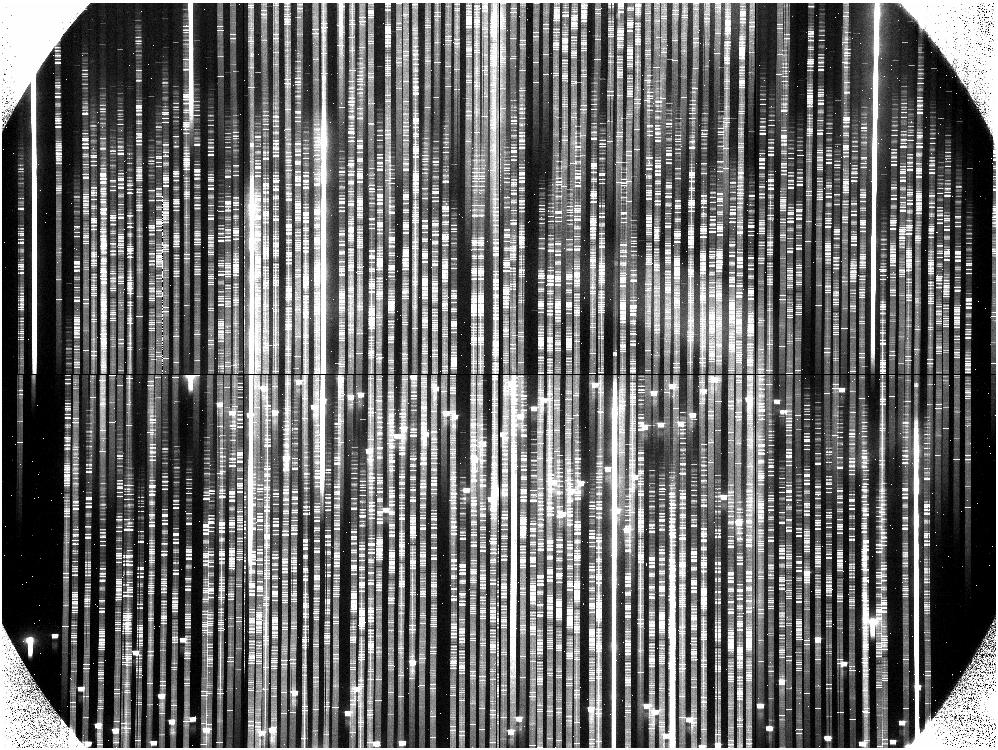
Aperture-plate spectrographs use small apertures in a focal-plane mask at the spectrograph entrance to transmit light from selected targets. Usually, computer-controlled devices (mechanical cutters, lasers) are used to cut apertures in a thin, shaped, metallic mask. Early designs used photographic masks. The apertures can be of arbitrary shape and length within overall constraints set by the spectrograph focal plane, but they normally have small widths in the direction of spectral dispersion. The distribution of spectra in the focal plane depends on the distribution of targets in the field. The main operational problem is to avoid overlap of spectra and to maximize use of the detector area in a given field; this requires special optimizing software. In principle, aperture plate designs should have better throughput, better sky background subtraction, and better flux calibration than fiber designs. Fiber designs can accommodate more targets, however, because the output format on the detector is fixed and optimally packed.- DEIMOS (Keck 10-m)
-
Slitmasks: 85 slitlets x
2 barrels; field size 16 arcmin
2000x4000x8 CCD detectors
|
IMACS Prism Slit Mask |
INTEGRAL FIELD UNITS
An integral field unit (IFU) produces distinct spectra for many contiguous elements in a given compact field. Powerful for the study of extended objects like globular clusters or nearby galaxies. Relative aperture positions and sizes are fixed and generally cover a square/retangular area. IFU's have been designed using fiber bundles, lenslet arrays, and configurable microaperture or micromirror arrays.-
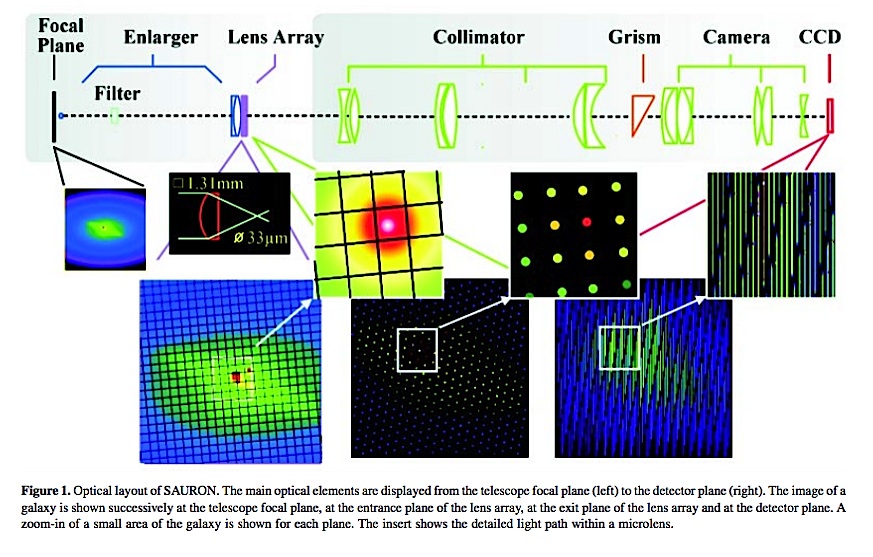
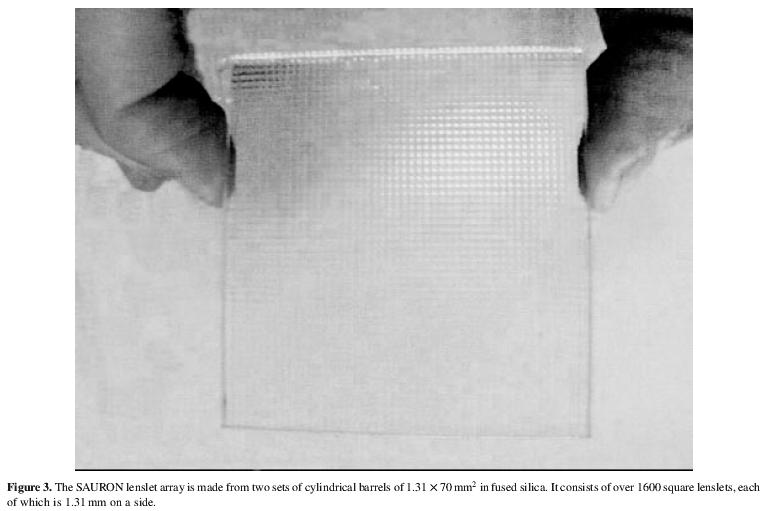
SAURON
-
Design
Telescope image is focussed on
an array of microlenses
which break up the 40x33 arcsec field into 1 arcsec images.
Grism disperser. Spectral range limited to 4800-5400 Å.
Slight rotation of dispersion direction with respect to lenslet array
achieves cross-dispersion so spectra don't overlap;
spectral length is limited by using an interference filter
Intended for areal studies (kinematics, populations, emission lines,
etc) of nearby galaxies. Example SAURON
science:
mass-to-light ratios and Fundamental Plane for early-type
galaxies
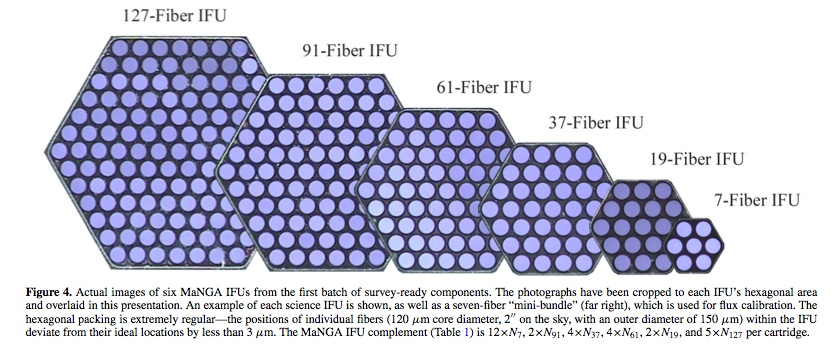
- SDSS-III
MaNGA System
-
Uses the upgraded SDSS-III
BOSS spectrographs (3600-10300 Å).
For each field, can deploy up to 17 fiber-based hexagonal IFU units,
in sizes (see above) ranging from 19 up to 127 fibers (12-32" field
diameters; 2" fiber cores), across the 3o field. 1423
fibers total. For more information on the MaNGA fiber system, see
Drory
(2015).
Intended for areal spectral studies of up to 10,000 galaxies
- JSWT NIRSpec
-
The Near Infrared Spectrograph on the
6.5-m James Webb Space
Telescope, scheduled for a 2021 launch, employs an IFU
based on
a microshutter
array. The array contains over 62,000 cells (about 100x200
microns each) that can be opened or closed by a magnetic controller to
admit light to the spectrograph.
More information on
JWST microshutters (S.H. Moseley)
GRISM FULL-FIELD SLITLESS SPECTROSCOPY
A "grism" is a prism with a transmission grating mounted on its entrance face. This combination produces a series of spectra of each source in the focal plane, with the first and second orders of most interest. There is also a zeroth-order image of each source, which provides a means to determine the order positions and wavelength scales for that source. Grisms are used only for low resolution spectroscopy. Grisms can be deployed in the same way as a filter, without a collimator, ahead of the focal plane of an imaging camera. Grism spectrographs are normally operated "slitlessly," without focal-plane apertures, so they image the entire field. This captures spectra of any object in the field, which is their primary advantage. The main operation/data-reduction complication is the overlap of spectra from different sources or even different parts of the same extended source. To mitigate overlap, spectra are typically taken with the spectrograph oriented in multiple (say up to 5) different position angles on the sky. Even where there is no object overlap, the superposed spectrum of the background sky limits signal-to-noise. Data reduction pipelines are complex (e.g. see Pirzkal 2017).
|

WFC3 IR Grism Frame |
HIGH PRECISION DOPPLER SHIFT SPECTROSCOPY (Planet Detection)
The most conspicuous use of high precision spectroscopy has been in the detection of extra-solar planets through stellar reflex Doppler shifts, where velocity differences of order 5 m/s must be measured. Requires both high spectral resolution and great mechanical/optical stability. Suitable designs employing digital detectors have been around since the late 1970's (e.g. Campbell et al. 1988) but were not energetically exploited until the surprising detection of a Jupiter mass planet in a sub-AU orbit made in 1995 by Mayor & Queloz at Haute-Provence Observatory.
|
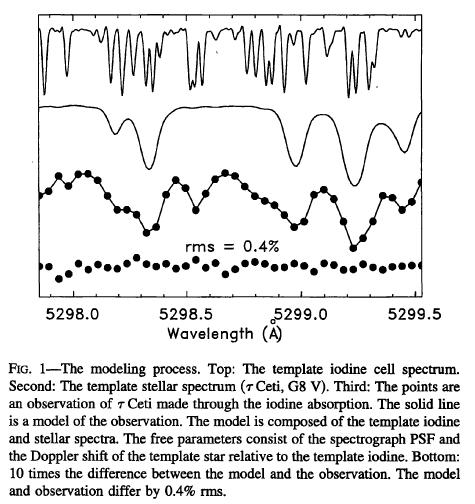
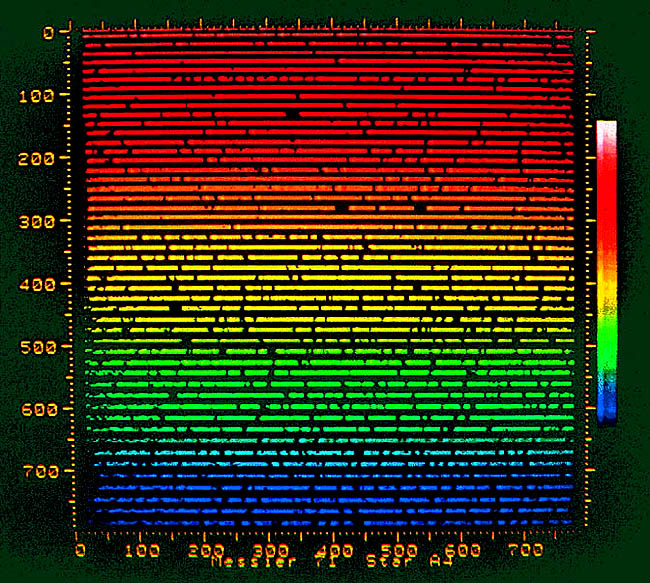
Sample Hi-Res Iodine Cell Spectrum |
- Sample velocity curve (51 Peg) (first normal exoplanet to be verified, with a velocity amplitude of +/- 50 m/s)
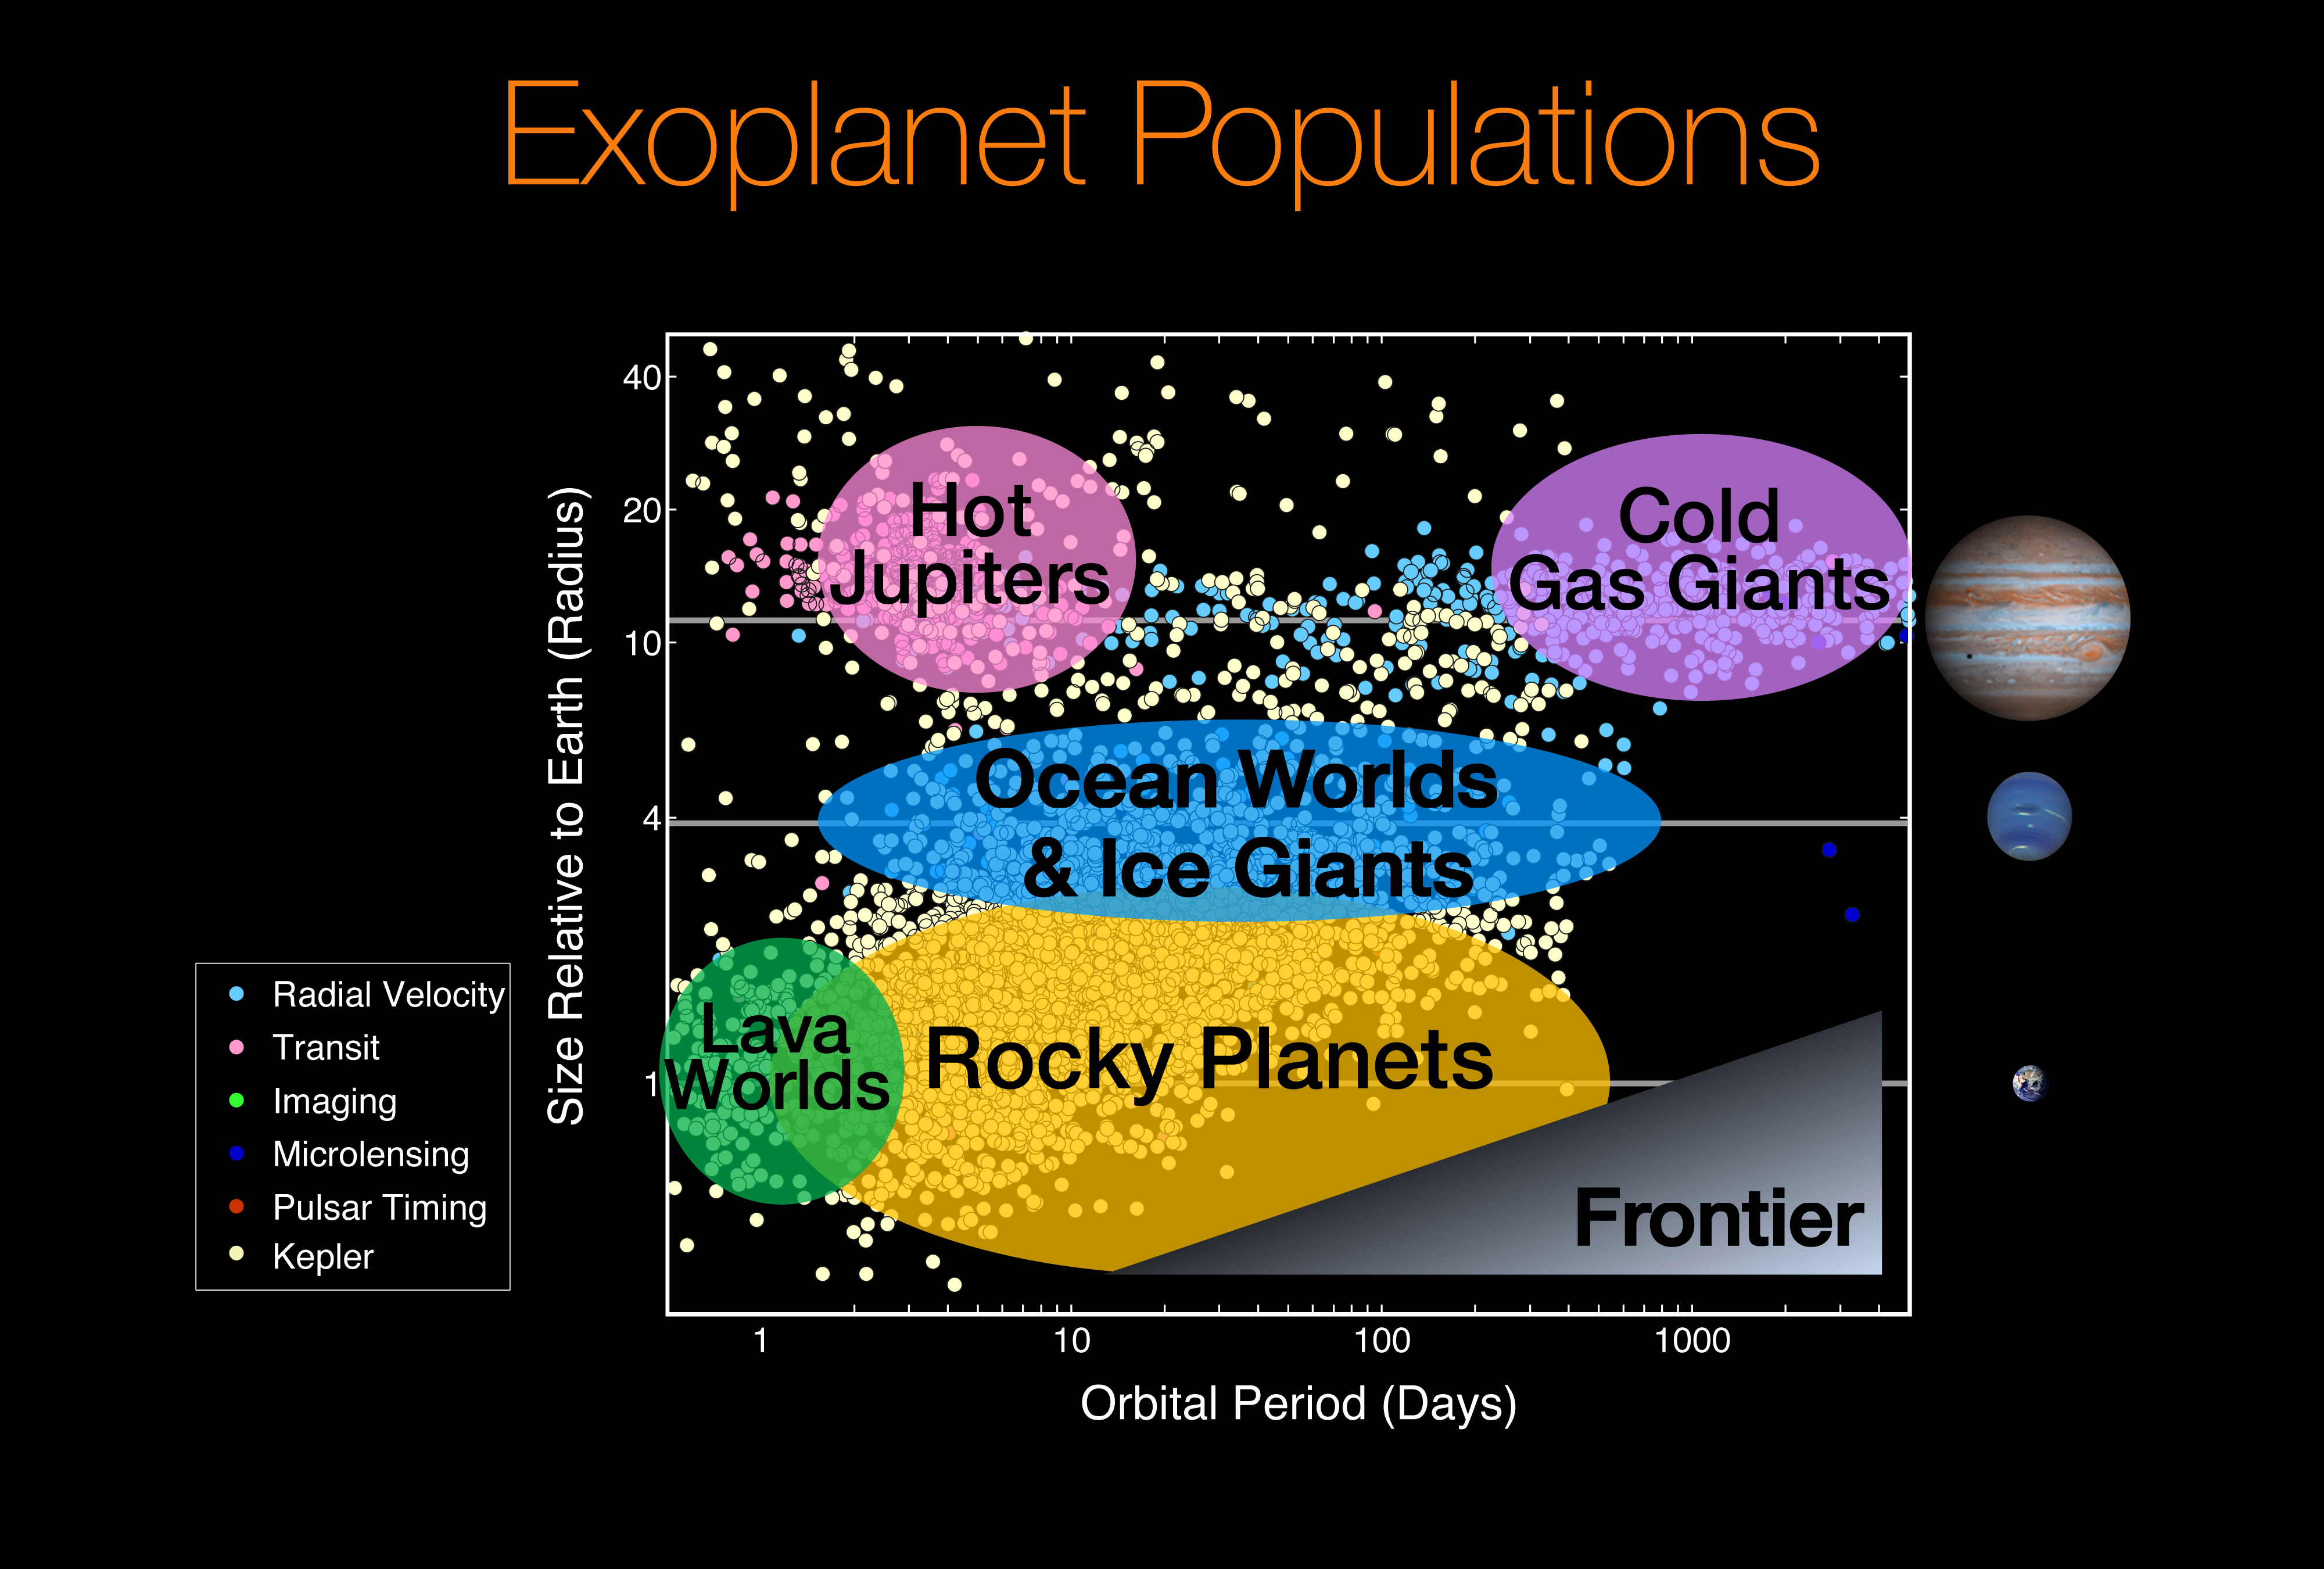
- Exoplanet Database
OTHER ILLUSTRATIONS
 Previous Lecture
|
 Lecture Index
|
 Next Lecture
|
Last modified November 2020 by rwo
Grism data frame from Pat McCarthy. Text copyright © 2001-2020 Robert W. O'Connell. All rights reserved. These notes are intended for the private, noncommercial use of students enrolled in Astronomy 511 at the University of Virginia.