ASTR 1230 (O'Connell) Lecture Notes
7.2 ASTRONOMICAL SPECTROSCOPY

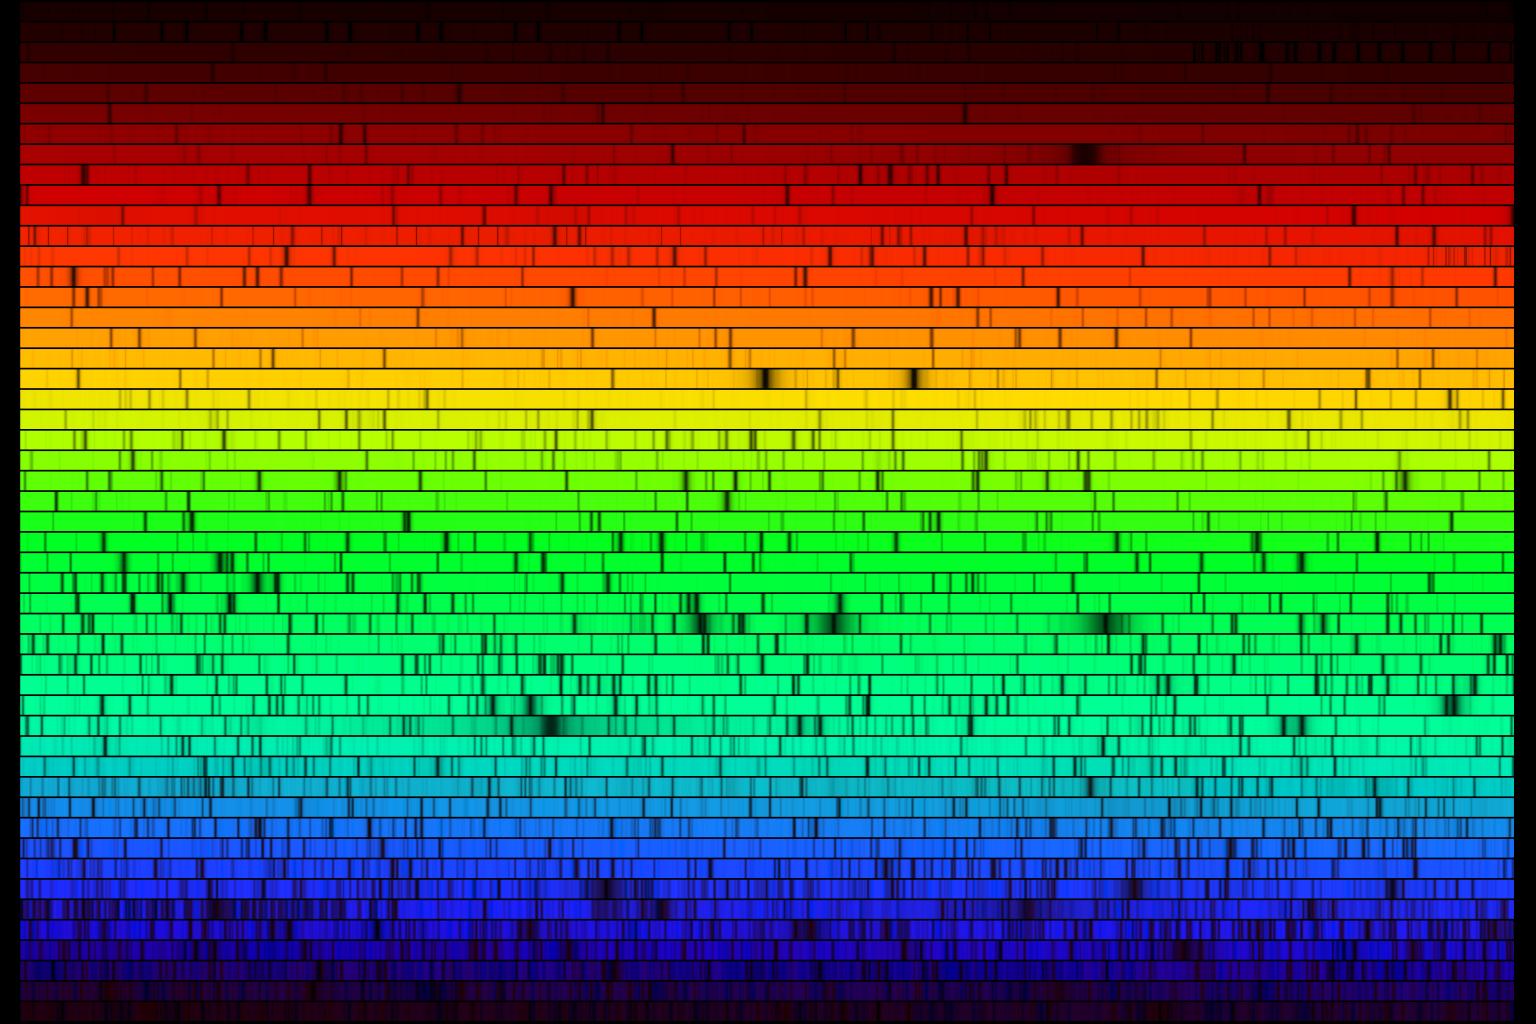
Spectrum of the Sun (wrapped) from near-ultraviolet (lower left) to near-infrared wavelengths (upper right). From NOAO.
A. INTRODUCTION
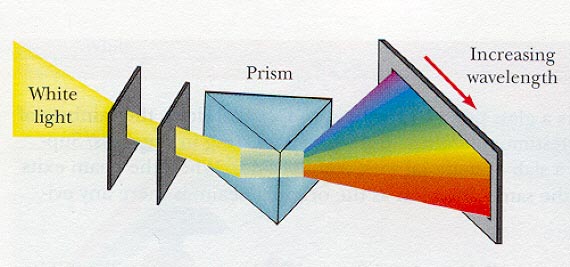
Spectroscopy is the study of how the EM energy released by a cosmic source is distributed over wavelength. This distribution is known as a spectral energy distribution or more simply the "spectrum" or the source. Typical astronomical spectrographs use prisms or diffraction gratings to disperse light according to its wavelength. The drawing below illustrates a prism spectrograph:
B. THE POWER OF SPECTROSCOPY
How is this useful?- We already saw in Lecture 5 that the overall shape and peak wavelength of the EM spectrum of a star are related to its temperature.
- This is true of any self-luminous, dense object: its EM spectrum is smooth or continuous and changes only slowly with wavelength. You can think of the atoms and electrons in such an object as interacting so strongly that the individual signatures of each type of atom are blended away.
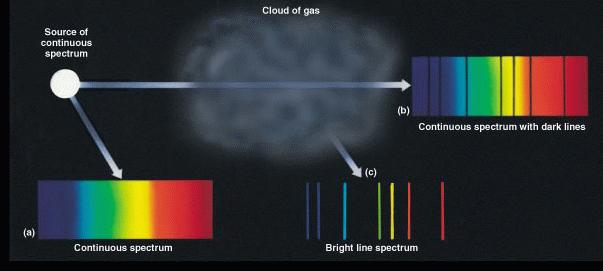
- On the other hand, in a dilute or thin gas---the atmosphere of the Sun, for example---the atoms do not interact strongly, and if there are enough atoms of a given type, they will impress their individual signatures on the emergent spectrum. The internal electronic structure of each type of atom consists of discrete energy states, and these states are unique to that type.
- In the spectrum of a dilute gas, electrons moving between the
states produce sharp features called "spectral lines."
They are seen either in
emission (if the gas is
observed in isolation) or
absorption (if it is observed against a continuous
source). The 3 general kinds of spectra are summarized in the
illustration below:

- Because each type of atom produces a unique spectrum, the
chemical composition of cosmic objects can be deduced from
their spectra even though they may be millions of light years away.
-
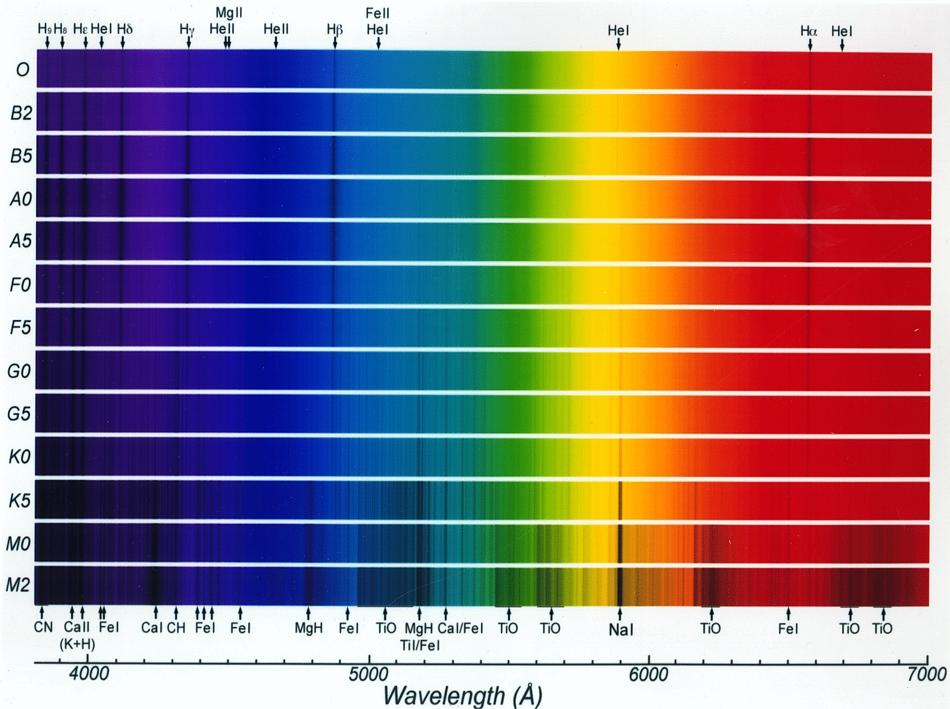
The figure below shows optical-band spectra of 13 kinds of stars. The
dark lines are produced by atoms of hydrogen, calcium, magnesium,
iron, sodium, titanium, and other elements. Quantitative analysis of
such spectra allows us to determine the detailed chemical makeup of the
Sun and other stars.
For example, the element helium (the
second lightest after hydrogen) was discovered in the spectrum of the
Sun before it was studied in an Earth-bound laboratory; several
absorption features of helium (labeled "He") are identified in the
figure.
The figure shows how the prominent absorption lines change with the
temperature of the star. The labeling at the left hand side gives the
spectral
type of each spectrum. From top to bottom the type listing runs
from high (30,000o) to low (3,500o)
temperatures. The incidence of strong absorption lines increases in
cooler stars. Click for an enlargement.

- In addition, spectra also contain information on the velocity, pressure, density, temperature, ionization state, turbulence, magnetic field strength, and other physical characteristics of cosmic objects. Spectroscopy is therefore an exceedingly powerful tool. It is the source of much of the astrophysical information we have about the universe.
- Perhaps the most famous application of astronomical spectroscopy is the use of the "Doppler shift" in the spectra of distant galaxies to demonstrate that the universe is expanding.
- In modern professional observatories, spectrographs are frequently the largest, most sophisticated, and costly instruments used with telescopes. For a representative sampling of recent state-of-the-art spectrographs, see this lecture from my ASTR 5110 course.
 Lecture 7
|
 Lecture Index
|
Web Links:
-
Background information on EM radiation, atomic physics, spectra, & the
Doppler Effect (ASTR 1210, O'Connell)
Last modified December 2020 by rwo
Spectral class/absorption feature diagram © M. Briley. Text copyright © 2001-2020 Robert W. O'Connell. All rights reserved. These notes are intended for the private, noncommercial use of students enrolled in Astronomy 1230 at the University of Virginia.