ASTR 1210 (O'Connell) Study Guide
19. EVOLUTION OF THE TERRESTRIAL ATMOSPHERES
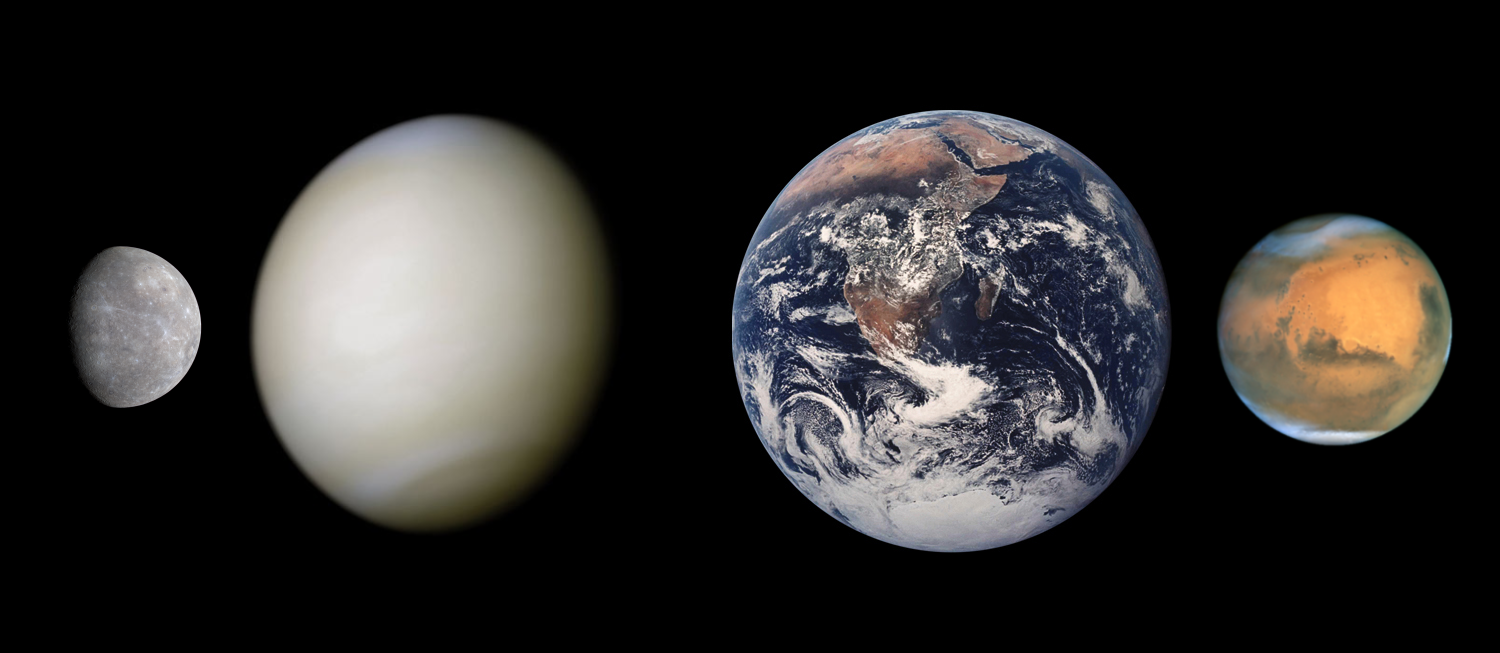
Scaled photos of the terrestrial planets.
A. Venus, Earth, Mars: No Two Alike
| VENUS | EARTH | MARS | |
| Relative Planet Mass | 0.8 | 1.0 | 0.1 |
| Relative Distance from Sun | 0.7 | 1.0 | 1.5 |
| Relative Atmospheric Mass | 100 | 1.0 | 0.01 |
| Bulk Atmospheric Composition | CO2 | N2, O2 | CO2 |
| Relative Water Vapor | 0.0001 | 1.0 [1%] | 0.03 |
| Mean Surface Temperature | 460oC | 15oC | -60oC |
- As we have seen in discussing the individual terrestrial planets,
there are huge differences in atmospheric mass, composition, and
surface temperature despite a modest range of distances (only a
factor of 2) from the Sun and similar masses, at least for
Venus & Earth.
-
There is a 10,000:1 range in the mass of the atmospheres of the
three planets. Mars has one-tenth the Earth's total mass but an
atmosphere 100 times smaller. Venus has an atmospheric mass 100 times
larger than the Earth despite being a slightly smaller planet. The
atmospheric pressure at the surface of Venus is also 100 times that on
Earth (or the same as the water pressure in a terrestrial ocean at a
depth of 3300 feet).
Earth has a nitrogen-oxygen atmosphere, but both Venus and
Mars have carbon dioxide atmospheres.
Earth has a water-rich atmosphere, in which 1% of atmospheric
gases are water molecules. But both Mars and Venus have extremely
dry atmospheres. Mars has proportionately 30x fewer atmospheric
water molecules than Earth; and Venus is 300x poorer in water than
Mars.
- There are enormous temperature differences. The "Goldilocks" syndrome for lifeforms like us: Venus is much too hot; Mars is too cold; but Earth is "just right".
- The "habitable zone" for Earthlike life is the region
surrounding a star within which liquid water can be stable on
planetary surfaces. Given the temperatures quoted above, the HZ
for the Sun is evidently small: about 0.9-1.4 AU. At present it
contains no planet other than the Earth.
- The Sun's HZ is a tiny fraction of the total volume of the
Solar System, whose planetary orbits lie in the range 0.4 to beyond 40
AU. (We discuss habitable zones further
in Guide 23.)
B. Geophysical Atmospheric Processes
Many different geophysical processes affect atmospheres, acting to augment, decrease, or change their contents. Important examples:- Energy input from the Sun
-
Solar radiation, across the entire electromagnetic spectrum from the
ultraviolet to the far-infrared, has a dominant effect on planetary
atmospheres. It is the primary source of energy input for the
terrestrial atmospheres. The most important changes in solar
radiation output occur on billion-year timescales as the solar
interior adjusts to the accumulation of burnt fuel in the form of
helium atoms. That has caused slow brightening of the sun
over the past 4 billion years.
Activity on the surface of the Sun (e.g. sunspots and solar flares)
associated with strong magnetic fields changes over an 11-year cycle,
but the mean changes in total radiation output during the cycle are
small, only about 0.1%.
- Infall of interplanetary material (protoplanetary solids,
comets, meteoroids)
-
Infall, plus gases captured gravitationally directly from the solar
nebula, was the source of the earliest or "primordial"
atmospheres of the terrestrial planets but has probably not been
important in the last 3.5 billion years.
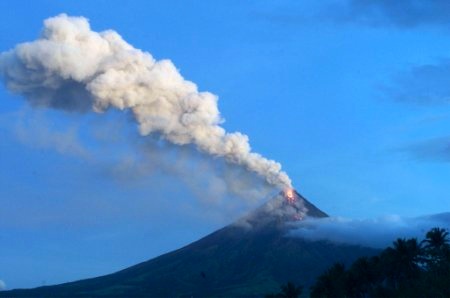
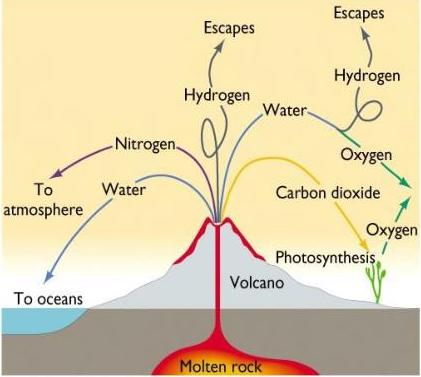
- Volcanic outgassing (see picture above)
- Volcanic
activity, driven by high internal temperatures, releases
H2O, CO2, SO2, and many other
compounds from the interior into the atmosphere. This was
the dominant source of the present (or "secondary")
terrestrial atmospheres and of the oceans on Earth.
- Escape of gases to space and stripping by the solar wind
-
Any molecule near the top of an atmosphere with a velocity higher than
a planet's gravitational
escape velocity (see Study Guide 8)
can escape to space and not return. As a result of collisions with
other molecules, a small fraction of each kind of molecule will be
moving faster than escape velocity at a given time. The smaller the
mass of the molecule, and the higher the temperature of the atmosphere,
the larger is the fraction of molecules that can achieve escape.
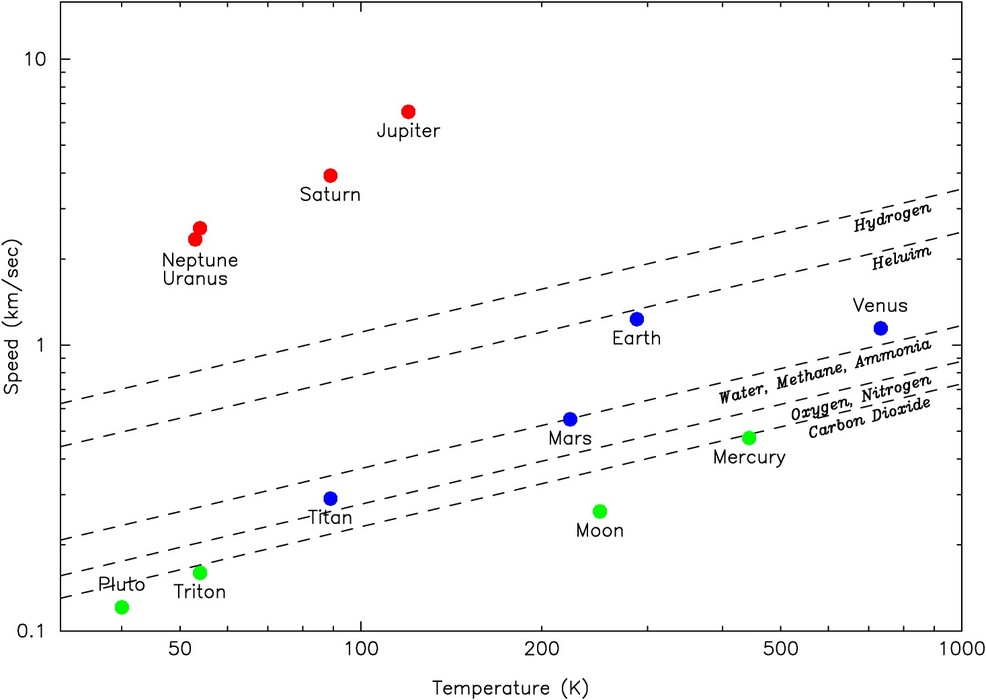
- See the figure at the right (click for enlargement). The solid
symbols show the escape velocities for various planets as a function
of atmospheric surface temperature. The dashed lines show velocities
for molecules of different species of gas at the top of their
atmospheres. Any species whose velocity lies above the symbol for a
given planet will escape to space over time. The four largest planets
(in red) retain all molecular species. Earth and Venus retain all but
hydrogen and helium.
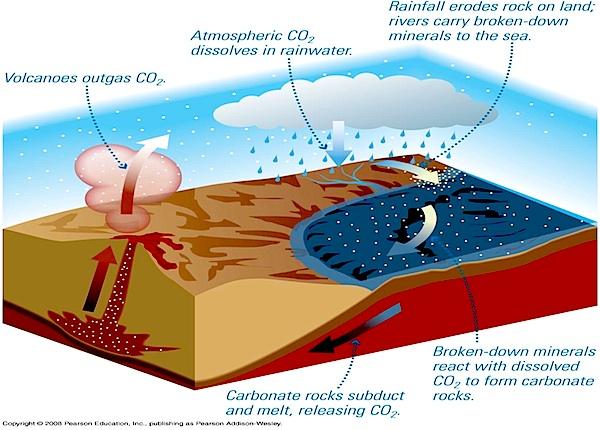
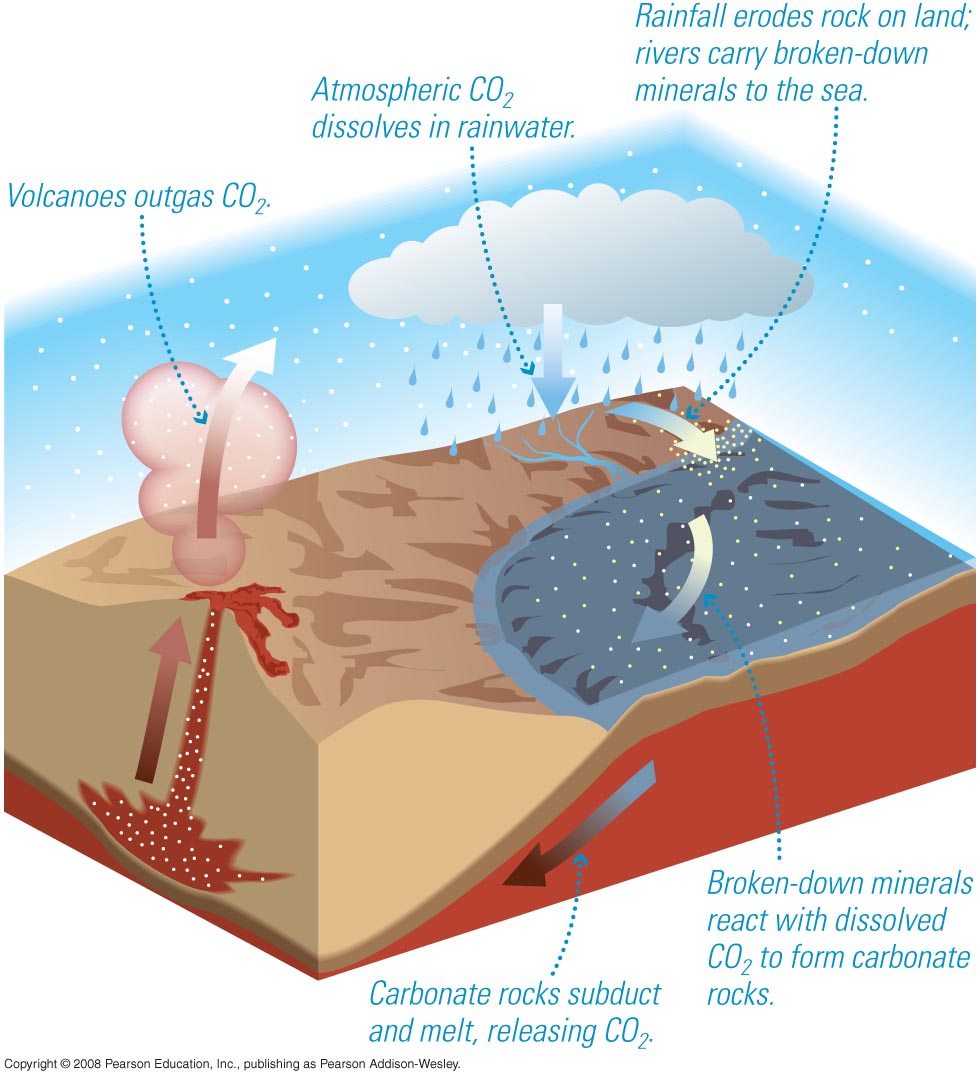
- "Carbonate-silicate cycle"
-
See the illustration above. This cycle involves a transfer of carbon
between the Earth's surface, its atmosphere, and its crust.
CO2 vapor is washed out of the atmosphere by liquid
H2O precipitation and is bound through chemical
reactions involving silicate rocks into solid limestone
on the seabeds. Deposition over the last billion years has been
assisted by sea animals leaving their shells behind.
Recycling of the crust into the interior melts the rocks
and returns CO2 to the atmosphere through volcanic
outgassing.
The net effect of the cycle depends on the relative strengths of the
deposition and return branches, and in turn these depend on other
environmental factors. Throughout most of Earth's history
the deposition rate has been larger than the return rate, so
this process has tied up massive amounts of CO2 in
terrestrial surface rocks (about 100 times the current
atmosphere's mass).
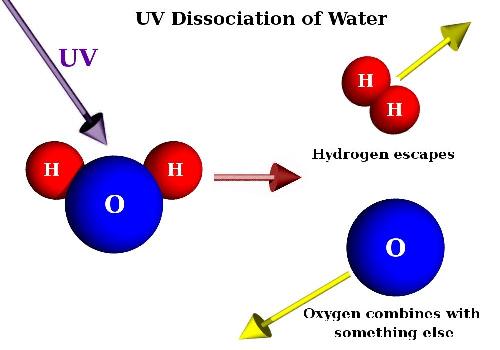
- Photo-Destruction of H2O
- UV radiation dissociates H2O molecules in the upper atmosphere,
allowing H to escape to space (as described above). O2
combines with other molecules, and the water is lost. Since
almost all water is trapped at low altitudes in Earth's atmosphere,
this is not an important process there; but it has had a major
effect on Venus.

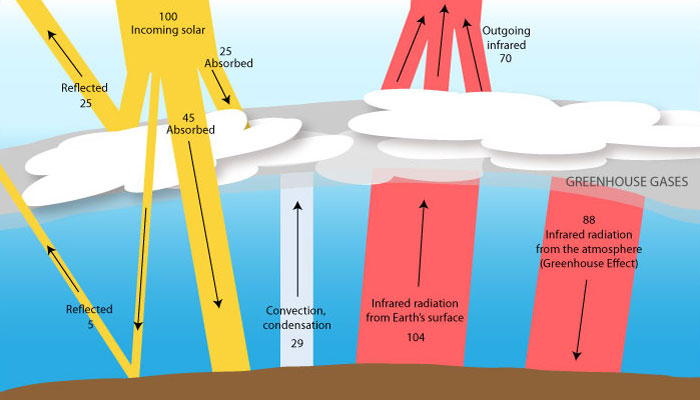
- The Greenhouse Effect
-
Absorption of sunlight is the primary source of heat for the
atmosphere and surface of the terrestrial planets. But secondary
heating of the surface and lower atmosphere is caused by
the partial trapping of infrared radiation from the planet's
surface by certain gases (especially H2O, CO2,
CH4, O3). See the diagram above.
- Even though these are only "trace gases" in Earth's atmosphere
(for instance, CO2 constitutes only 0.04% of the volume of
the atmosphere), they account for
almost all of the infrared blocking of radiation from the
Earth's surface. Hence, they constitute a powerful "choke-point" in
the flow of atmospheric heat, so they have a major effect on the
temperature balance. For more details on this "Greenhouse Effect,"
see the diagram above (click for enlargement)
and Study Guide 15.
- Escape of gases to space and stripping by the solar wind
C. Equilibrium
The cycle rates for geophysical processes affecting the atmosphere can be very fast in geological time:-
For example, in 50 Myr, which is only 1% of Earth's age...
- 1 "bar" (= the present mass of Earth atmosphere) of CO2
can be outgassed from Earth's interior
- 1 bar is 2500x the present CO2
content of Earth's atmosphere.
- 1 bar of CO2 can be washed out of Earth's atmosphere by precipitation of CO2-bearing liquid water or ice
- 1 ocean of H2O can be evaporated & dissociated on Venus
-
If the rates don't balance, there would be relatively rapid evolution
toward more extreme conditions until a new balance is reached.
All significant processes must be considered. In complex
systems like planetary atmospheres it is easy
to overlook important factors.
- Example: the carbonate-silicate cycle provides negative
feedback to help regulate the temperature of Earth's surface.
If the atmospheric temperature rises, there will be increased
evaporation from the oceans, which washes more CO2 from the
atmosphere, which decreases the Greenhouse trapping and hence the
temperature. If the temperature falls, the reverse situation occurs.
This stabilizing feedback occurs only over periods which
are long by human standards (about 400,000 years), however, and
is never able to keep the climate perfectly stable. But it helps
prevent a runaway Greenhouse on the one hand or a permanent ice age
("snowball Earth") on the other.
D. Three Histories
For the Earth, we have a huge fund of geophysical data based mainly on atmospheric and ocean composition, surface geology, and cores bored in ice and sediments from which we can infer its earlier history. Our knowledge of Venus and Mars is much more limited, but the main historical events can be pieced together. We are not sure whether the terrestrials had significant primordial atmospheres, but these would have been rich in hydrogen gas, most of which was able to escape their low gravities. Early energetic winds from the forming Sun would likely have stripped the remainder. The existing ("secondary") atmospheres of Earth, Venus, and Mars were predominantly outgassed from the interior, amounting to probably 100 bars on Earth and Venus but less on Mars.- The outgassed material consisted mainly of H2O,
CO2, and SO2. Fresh outgassing occurs on Earth
today and probably to some extent on Venus (though without major eruptions);
there is none on Mars. An alternative subsidiary source of water and
atmospheric gases: comet impacts.
Earth: "It's the water"....
- Earth's distance from the Sun is "just right." A moderate Greenhouse, driven by the four main Greenhouse gases, elevated the average surface temperature about 30oC (54oF) to above the freezing point of water. This much Greenhouse warming was essential to having a robust biosphere on Earth.
- Earth's mean surface temperature has been in the range such that outgassed water stays liquid near the surface.
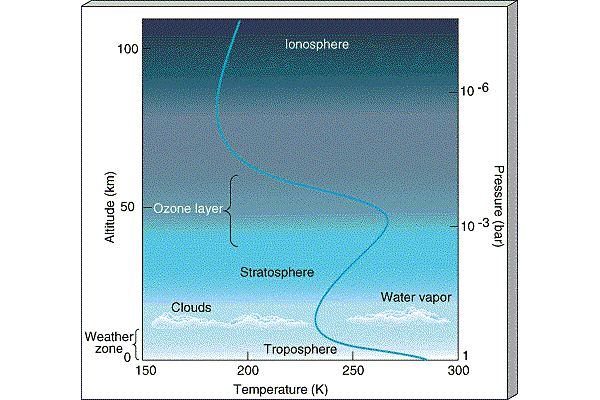
- There is a "cold trap" at modest altitude in Earth's atmosphere where the temperature drops below the freezing point of water. (See this temperature profile.) Because of the trap, rising water vapor condenses into droplets or ice crystals and ultimately falls back to the surface. This prevents escape of water to the stratosphere and therefore destruction by solar UV radiation. Water is retained near the surface. The oceans condensed from water vapor outgassed by volcanos.
- Water vapor washed most CO2 out of the atmosphere, depositing it in minerals on the ocean floors. The bulk CO2 content has continued to decline over the last 500 million years, though there have been occasional large excursions for reasons that aren't entirely understood. The remaining gaseous CO2 constitutes only about 0.04% of the bulk atmosphere today.
- With water vapor condensed into oceans and CO2 scrubbed from the atmosphere, outgassed nitrogen became the dominant gas in the atmosphere, although its total mass is far smaller than the total original complement of outgassed material.
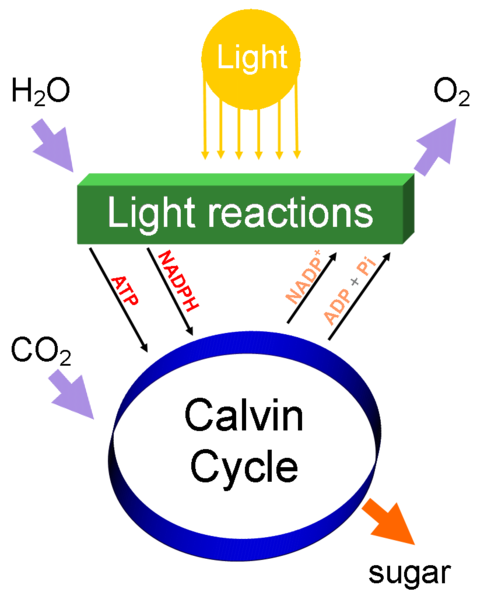
- The oceans provided the environment necessary for
life to develop about 3-3.5 billion years ago. Organisms
such as blue-green algae capable
of photosynthesis
then processed atmospheric gases to
release
free oxygen (O2).
-
The Earth is the only planet where lifeforms have had an important
effect on the atmosphere.
By about 2 billion years ago, significant amounts of oxygen were
present in the atmosphere. The oxygen density then rapidly increased
about 500 Myr ago, coinciding with the
"Cambrian explosion"
in the diversity of lifeforms which thrive on oxygen. Free
oxygen is the most important global tracer of the presence of
Earth-like life. The oxygenation of Earth's atmosphere also
significantly changed the kinds of minerals present on its
surface.
- Plate tectonics on Earth have had important effects on the atmosphere because they redistribute ocean and atmospheric circulation, change the nature of exposed soils, and change the volume of volcanic outgassing over periods of 50 million years and longer.
- During most of the time since the atmosphere formed, the mean Earth surface temperature has been hotter than at present. However, there is some evidence for one or more extended cold periods so intense that almost the entire surface was covered in ice -- a so-called "snowball Earth". The most recent of these was about 700 million years ago. Once ice is abundant enough, it will reinforce cooling because it reflects solar radiation. The snowball phase was probably terminated by the accumulation of outgassed CO2 from volcanos and subsequent Greenhouse heating.
- Over the past 500 million years, the Earth's mean surface temperature has varied within a relatively narrow band of about +/- 10o C (see this chart). (Probably not coincidentally, life has flourished in the oceans, on the land, and in the air during that time.) There have been cool periods up to 100 million years long favoring significant ice coverage, but most of the time polar ice has been minimal or non-existent. The latest 50 million years of history is described below.
Venus
- Because it is nearer the Sun and had a hotter surface, liquid H2O deposited by outgassing readily evaporated from its surface.
- Because of the higher temperatures, there was no cold trap. This allowed water vapor molecules to rise to high altitudes in the stratosphere, where they were destroyed by solar UV light.
- The absence of the carbonate-cycle cleansing by liquid H2O precipitation permitted the outgassed CO2 atmosphere to grow.
- The heavy H2O and CO2 atmospheric blankets
trapped infrared radiation from the surface ==> T rose further ==> more
liquid water evaporated ==> Greenhouse trapping increased.
- This positive feedback produced a "runaway" greenhouse effect
- All water was eventually removed from the atmosphere
- The end product of the runaway is the massive, hot, dry, CO2 atmosphere Venus has today.
- Continuous volcanic outgassing of materials like sulfur dioxide in the absence of water cleansing produced sulfuric acid clouds
- Without its abundant water, Earth would probably be like Venus. In fact, if the Earth as it is today were moved to Venus' orbit, it would probably evolve quickly toward the hellish Venusian state.
Mars
- Mars was more distant from Sun and therefore colder.
- Its smaller mass supported less outgassing from its interior and therefore a smaller Greenhouse Effect.
- Early, wet atmosphere & oceans? There is considerable evidence supporting this interpretation. The water era probably ended over 1 billion years ago. See Study Guide 16 and the Mars image page for more discussion.
- An early biosphere? There is some, but marginal, evidence in favor. See Study Guide 17.
- But Mars is a small planet compared to Earth. It has a large surface area compared to its volume, and therefore its interior cooled off more quickly. Sufficient CO2 was not resupplied from the interior; so the Greenhouse failed. Water eventually froze out and was presumably deposited in subsurface permafrost.
- The lack of an active interior also left Mars with a weak magnetic field, allowing the solar wind to strip away much of its protective atmosphere.
- Atmospheric pressure at the surface is now too low to prevent the evaporation of liquid water if any appeared.
- The end product is a thin, cold, dry atmosphere with only a trace of water vapor.
- Mars presents a harsh surface but one where, with difficulty, human colonies could live. By contrast, we could never live on the Venusian surface.
E. Lessons Learned for Atmospheric Evolution
- Little differences can have huge consequences
-
Our favorable environment is due mainly to our
distance from the Sun and secondarily to the size of our planet.
- Biospheres are fragile on Earth-like planets
F. Climate Change: Natural and Unnatural
So far, we have discussed the bulk properties of the terrestrial atmospheres: mass and composition as they change over hundreds of millions or billions of years. In this section, we consider recent atmospheric changes on successively shorter timescales. "Climate" refers to the behavior of surface temperature, precipitation, and wind flow over the short timescales (10's to 100's of years) of interest to human beings. Climate changes on the Earth have major practical consequences for us.-
The central question that has emerged, scientifically and politically,
in the last 40 years is whether human activities are contributing
to recent climate changes. It is obvious that the rapid
(exponential!) growth of the human species
(see Study Guide 9) coupled
with our use of technology will inevitably affect Earth's
atmosphere unless we take deliberate actions to avoid this. The
question is whether that has started to happen yet.
There is no doubt that some human-induced changes have begun, with the
partial destruction of the ozone (O3) layer, which
shields Earth's surface from solar UV radiation. But what about
more consequential changes?
Temperature History and Ice Ages
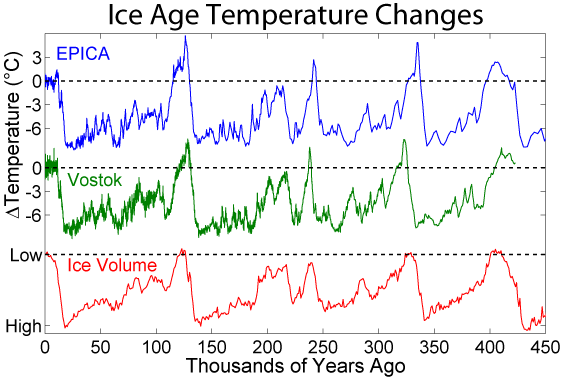
According to the empirical geological record, there have been four epochs of extensive glaciation on the Earth over the past 500 million years. We are living in the latest of those. From a high mean temperature about 15oC warmer than now about 50 million years ago, the atmosphere has cooled and precipitated a major glaciation epoch. By 34 million years ago the temperature had fallen to the point that the Antarctic ice sheets formed. The cooling continued to the lower levels that have prevailed for the last 8 million years. The most recent era of glaciation began about 2.6 million years ago and consists of a repeating cycle of cooler and warmer periods, with a temperature excursion of about 10oC. During the drop in the mean surface temperature in the cool periods, there are great expansions of the ice sheets from the poles toward the equator. These are the famous "ice ages". During the warmer periods, the ice retreats but never vanishes altogether. The ice ages typically last about 80,000 years, while the warmer "interglacial" periods last only about 20,000 years. These cycles are the most conspicuous climate events in recent geological history. The most recent ice age ended about 11,000 years ago, and at that time we entered an interglacial period that will last perhaps another 10,000 years. Temperature and ice volume histories covering the last half-million years, including 5 ice ages, are shown in the plot below. [Note that the ice volume scale is reversed from the temperature scales.] These are derived from drilling ice and ocean sediment cores up to 2 miles deep. You can see that a drop in the mean surface temperature of only about 3oC was sufficient to precipitate an ice age.
-
The small temperature changes that trigger ice ages are importantly
influenced by the astronomical "Milankovitch Cycles"
(see Study Guide 4) -- small
changes in the shape and orientation of Earth's orbit and the tilt of
its axis, which affect the amount of insolation in the polar regions.
The components of the Milankovitch cycles have periods between 25,000
and 100,000 years. The cycles are mediated by feedback from the
carbonate-silicate mechanism. All
of the changes and forcing mechanisms discussed so far have taken
vastly longer to transpire than the recent warming described in
the next section.
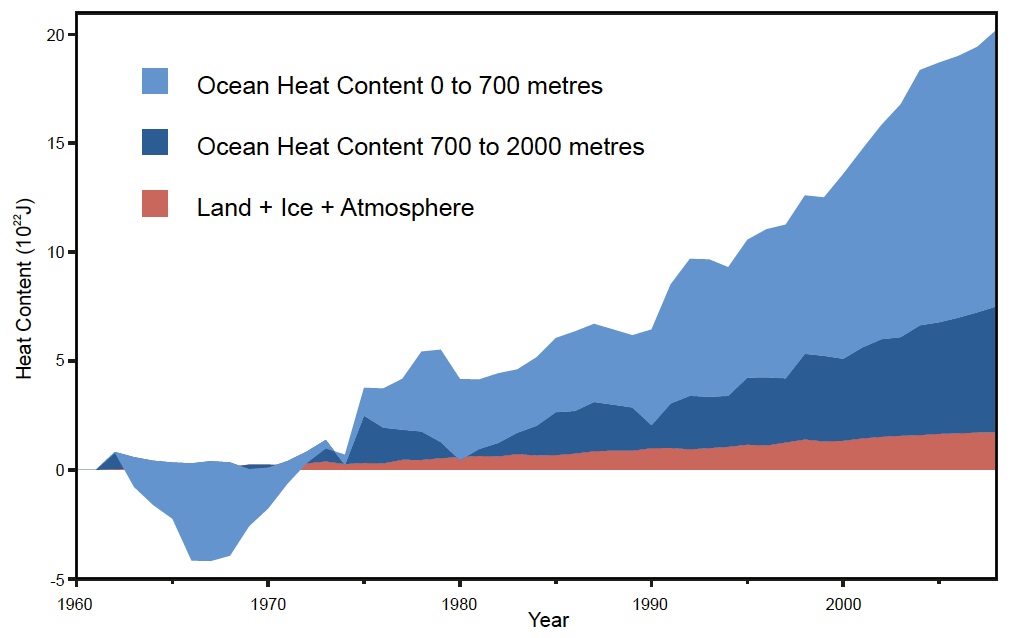
Recent Global Warming and Carbon Dioxide
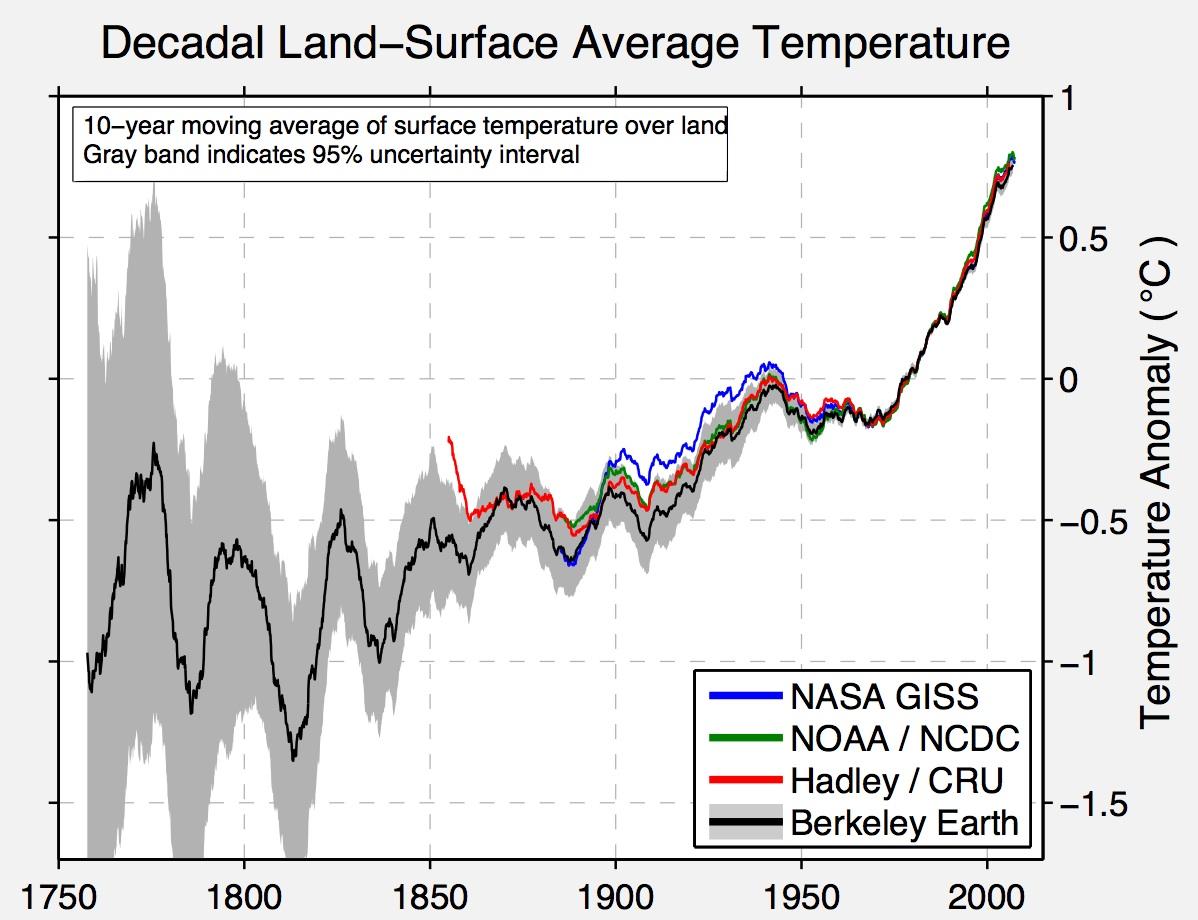
Intensive studies have also been made of the Earth's temperature history over the past 1000 years. Except for the period since 1900, such studies must rely on the use of various "proxies" for actual thermometric measures. The profiles show several major climate events: a "medieval warm period" (about 1000 AD) and a "little ice age" cool period (about 1600 AD). But the most important change observed in the last millennium is a rapid increase in Earth's mean surface temperature since 1900. Click on the thumbnails below for enlarged plots of recent changes in the surface temperature. An animation of global surface temperature changes on a monthly basis since 1850 is shown here.
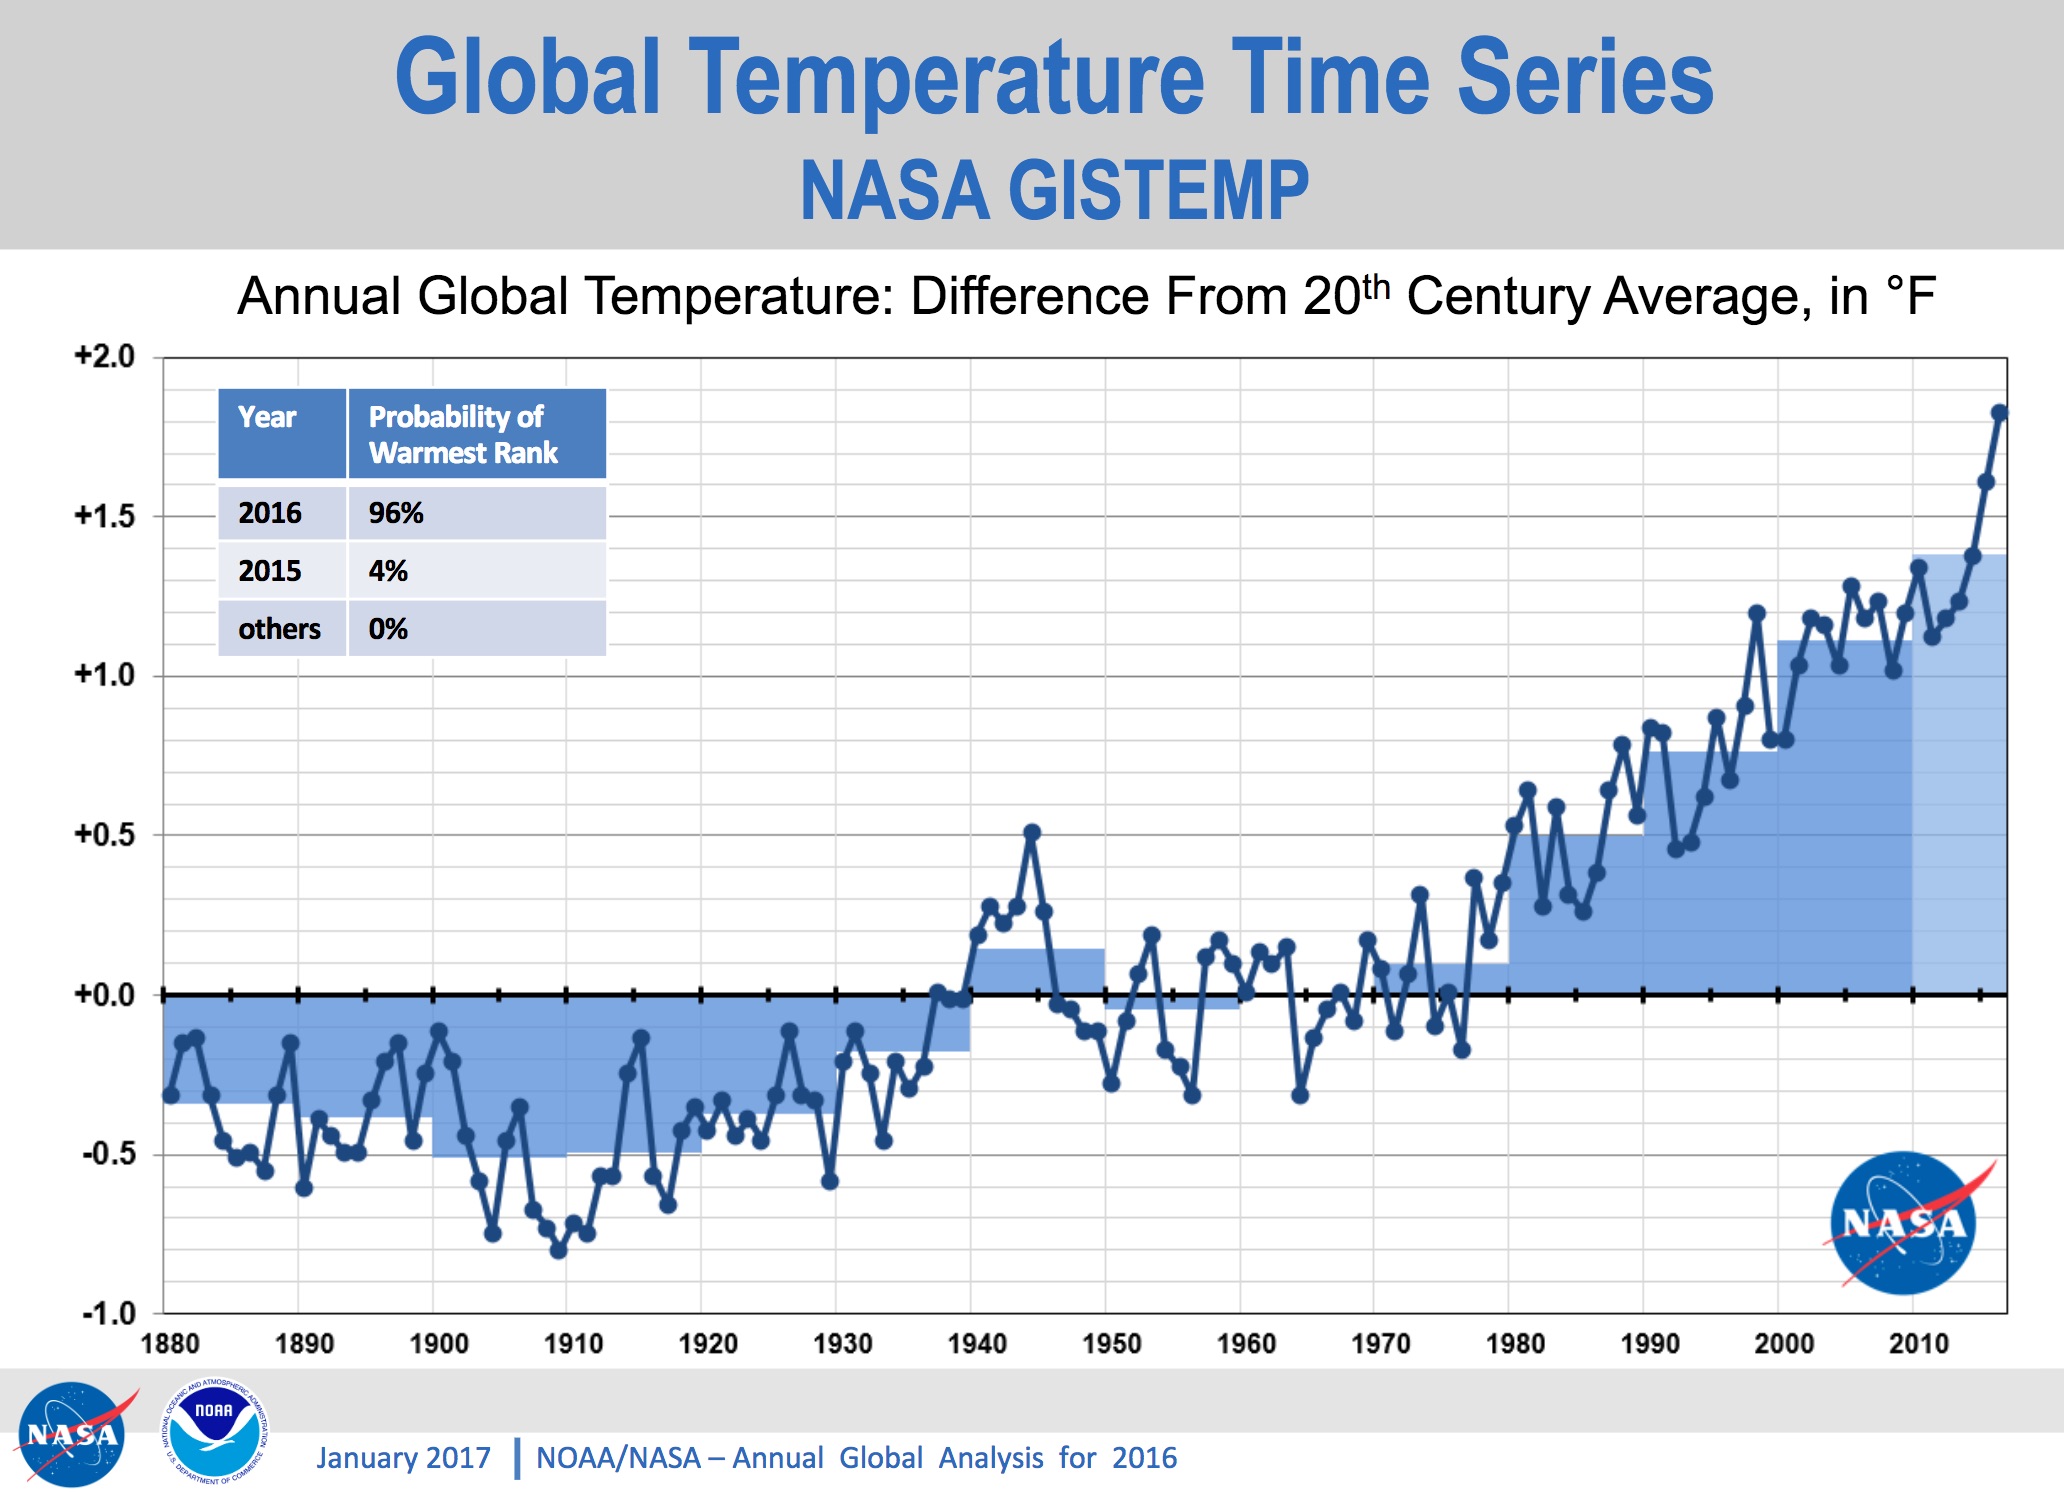 Surface temperature since 1880
 |
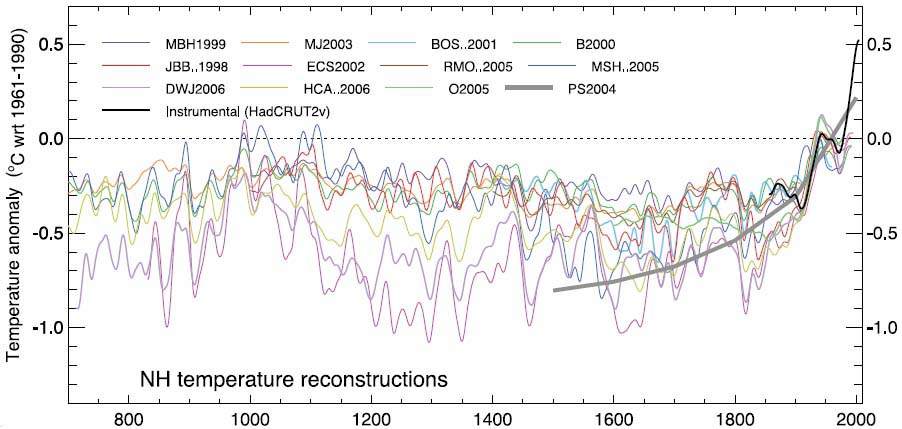 Surface temperature since 800
 |
- Remember, we're talking about global surface temperature
here, meaning averages over the entire surface of the Earth,
including the oceans, the southern hemisphere, night and day, and
through four seasons. So our local weather is only a tiny component
of the whole. For instance, there were abnormally cold temperatures in
the eastern US in January 2014, but that was, globally, the fourth warmest
January on record since 1880.
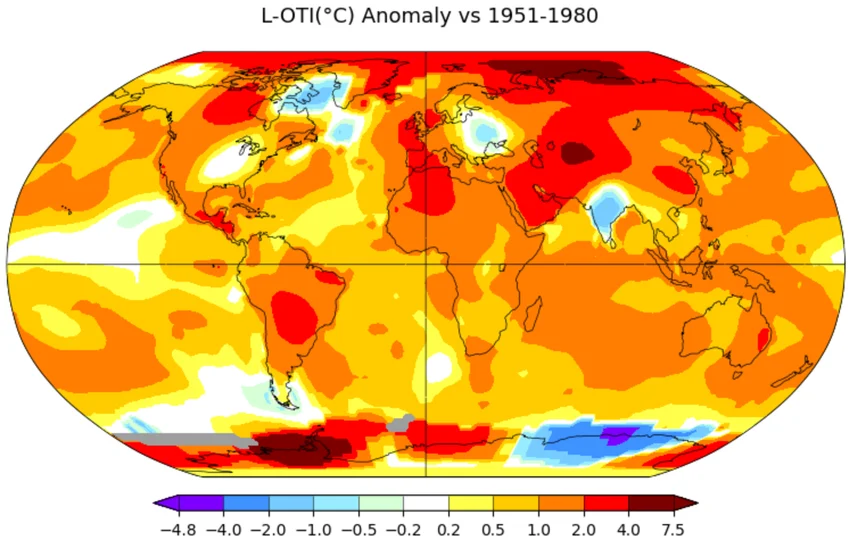
There are large variations in warming depending on geographic
location, as seen in the map below showing worldwide temperature
trends between 1976 and 2000.
Here is a more
recent map showing temperature changes for 2025 with
respect to mean temperatures between 1951 and 1980.
The current temperature excesses are quite striking: the ten
globally warmest years since 1880 have all occurred since 2014.

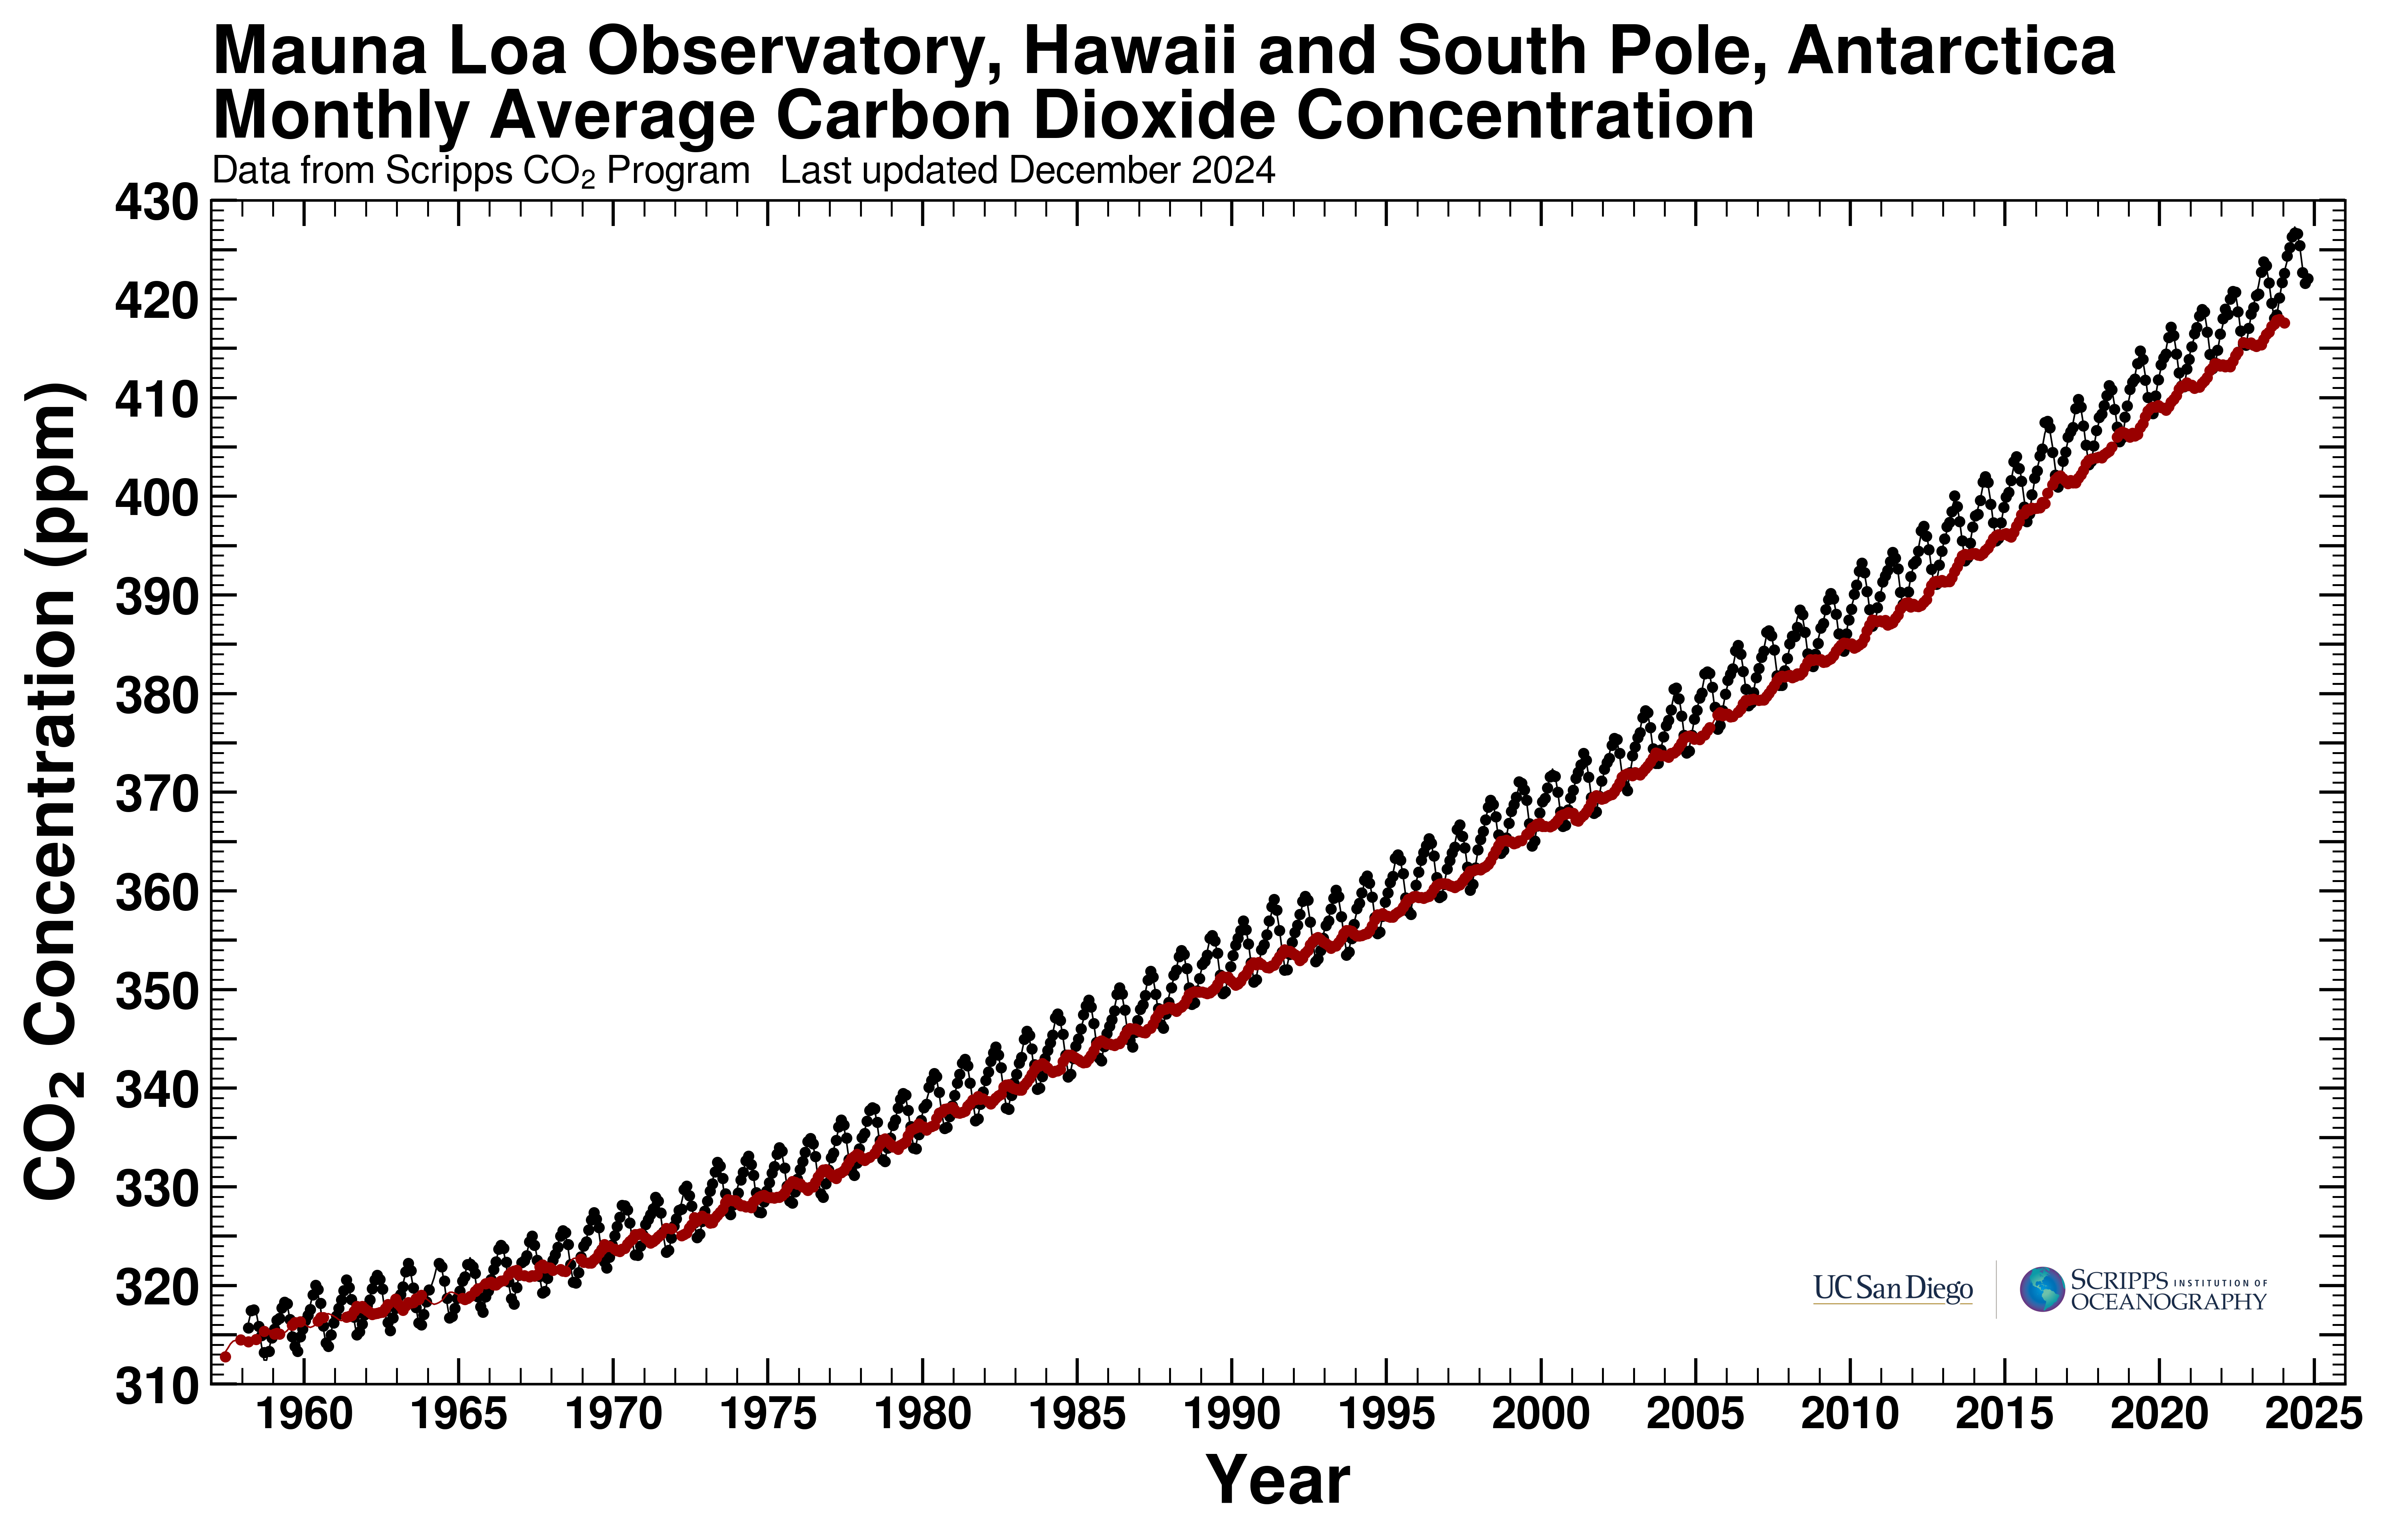 CO2 Concentration since 1960
 |
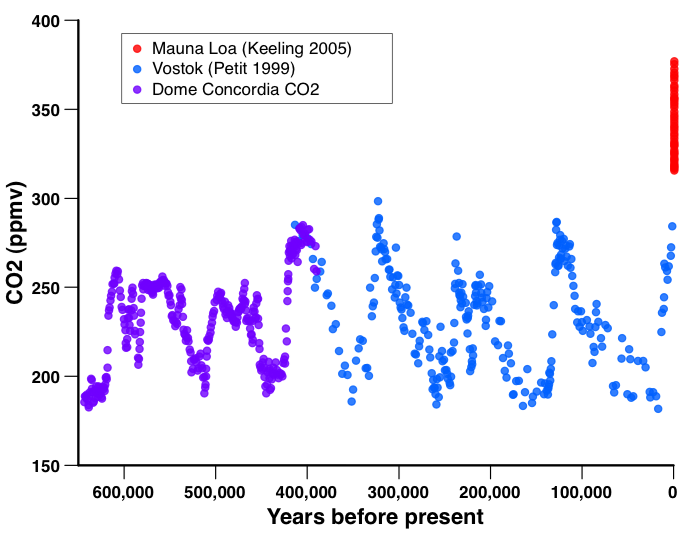 CO2 Concentration over 600,000 years
 |
Climate Modeling
How are we to interpret these changes, and is there a link between global heating and human use of fossil fuels and the consequent rise in CO2 concentration? The basic physical principles that govern the structure of planetary atmospheres have been well understood for a century. In fact, the first prediction that industrialization could lead to sufficient CO2 production to affect the Earth's temperature balance through the Greenhouse Effect was actually made 120 years ago by Swedish chemist Svante Arrhenius, based on earlier measurements of the absorptive capacity of Greenhouse gases by the English physicist John Tyndall. The first studies of the modern CO2 content of the atmosphere that led to predictions of dangerous global warming were presented to the oil industry as long ago as 1954.-
The central problem in modeling climate change is that the Greenhouse
Effect does not operate in isolation, and combining it with
a myriad of other processes and a large range of environments
to model a system as complex as the real terrestrial atmosphere is a
major challenge. It is necessary to account for important influences
from ocean currents, mountain ranges, cloud and aerosol shielding,
volcanic activity, and solar energy input, among other factors.
Another major technical difficulty is that the atmosphere is
a strongly "non-linear" system: output is not simply
proportional to input.
-
Mathematically, such systems can exhibit "chaotic" behavior,
i.e. divergent results for small changes in the starting point.
This kind of behavior is exemplified by
the "butterfly" effect: a butterfly flapping its wings off the coast
of Africa can, in principle, produce a hurricane over Florida several
weeks later.
 Here is a nice BBC video
showing how small disturbances are amplified by atmospheric
instabilities into large storms.
Here is a nice BBC video
showing how small disturbances are amplified by atmospheric
instabilities into large storms.
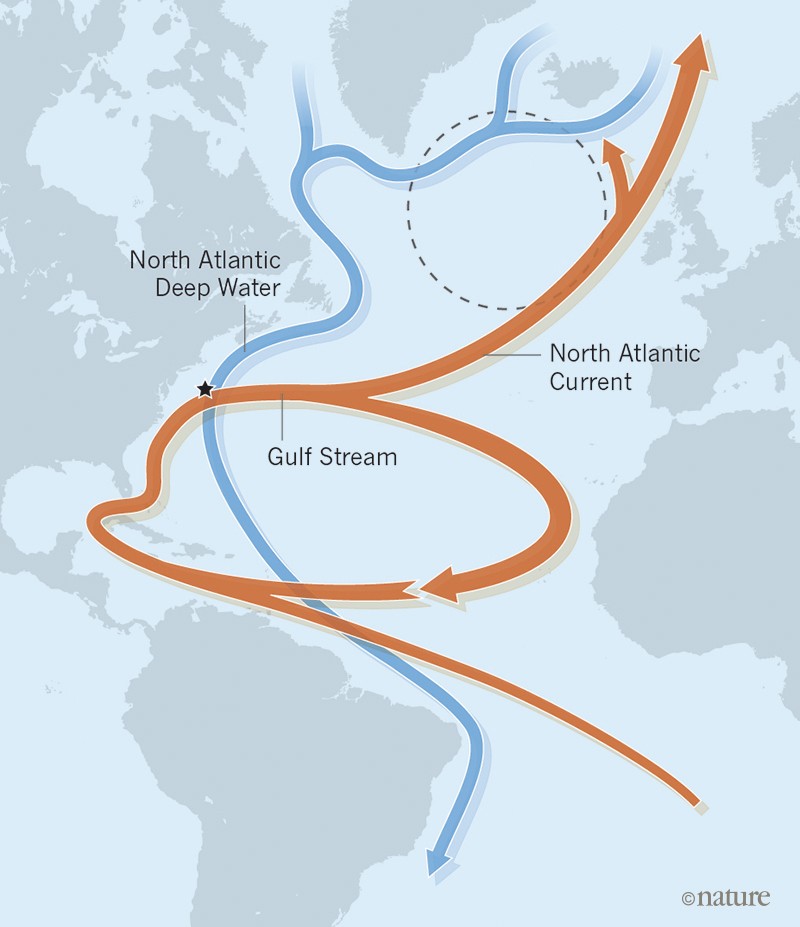 It is not only the atmosphere that must be understood and carefully
modeled. Paradoxically, an interruption of the
Atlantic ocean circulation currents (shown at the right),
which would occur if higher temperatures melt icepacks and allow more
freshwater to flow into the ocean, would lead to
drastic cooling of northern Europe. A February
2021
study finds that 9 out of 11 "proxy" measurements do indeed
indicate that the circulation currents are becoming weaker. A side
effect of circulation weakening would be yet larger sea level rise
along the eastern seaboard of the US.
It is not only the atmosphere that must be understood and carefully
modeled. Paradoxically, an interruption of the
Atlantic ocean circulation currents (shown at the right),
which would occur if higher temperatures melt icepacks and allow more
freshwater to flow into the ocean, would lead to
drastic cooling of northern Europe. A February
2021
study finds that 9 out of 11 "proxy" measurements do indeed
indicate that the circulation currents are becoming weaker. A side
effect of circulation weakening would be yet larger sea level rise
along the eastern seaboard of the US.
-
Recall that the pre-industrial complement of Greenhouse gases accounted
for a 30o C, or 54o F, increase in Earth's
surface temperature over its "bare" equilibriium temperature. This
much warming was beneficial, and the Earth's surface has long since
adjusted to it.
That warming occurred over hundreds of millions of years. The problem
we face today is that even a small further global temperature
increase (2o C) over a period as short as a century
would force a readjustment that would have dramatic effects on
weather, water distribution, sea levels, and growing seasons on a
human scale.
-
(Two degrees sounds ridiculously small and inconsequential, doesn't
it? But that much increase for the entire Earth's atmosphere
represents a tremendous increase in energy content. Recall that only
a 3o C change in global mean temperature in the other
direction could induce an ice age, with clearly catastrophic
consequences for human civilization.)
The Scientific Consensus
The scientific consensus, based on thousands of studies worldwide since the 1950's, is that some human-induced warming has occurred (probably at least 50% of the temperature rise over the last 60 years) and that significant additional warming is expected over the next 100 years. Here is a 2013 summary of the situation from the American Geophysical Union:- "Human activities are changing
Earth's climate. At the global level, atmospheric concentrations of
carbon dioxide and other heat-trapping greenhouse gases have increased
sharply since the Industrial Revolution. Fossil fuel burning
dominates this increase. Human-caused increases in greenhouse gases
are responsible for most of the observed global average surface
warming of roughly 0.8C (1.5F) over the past 140 years. Because
natural processes cannot quickly remove some of these gases (notably
carbon dioxide) from the atmosphere, our past, present, and future
emissions will influence the climate system for millennia."
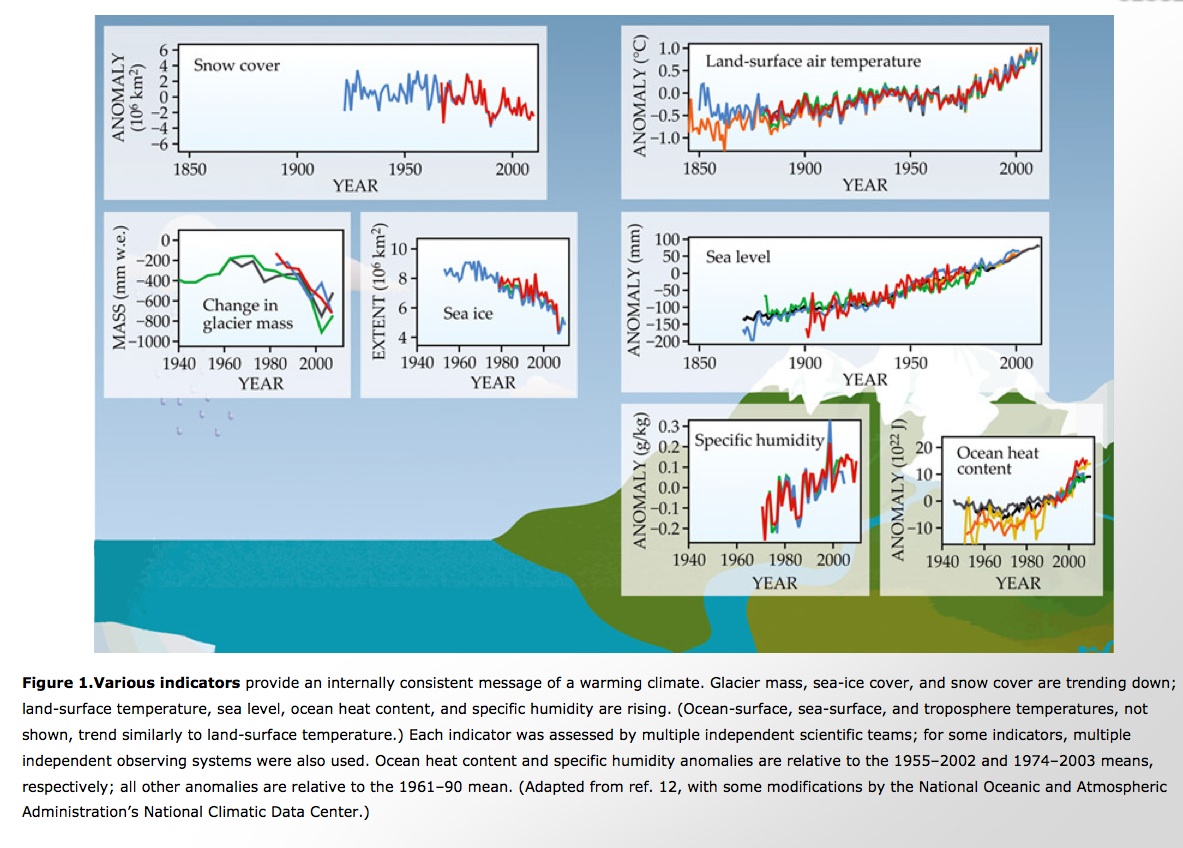
"Extensive, independent observations confirm the reality of global
warming. These observations show large-scale increases in air and sea
temperatures, sea level, and atmospheric water vapor; they document
decreases in the extent of mountain glaciers, snow cover, permafrost,
and Arctic sea ice. These changes are broadly consistent with
long-understood physics and predictions of how the climate system is
expected to respond to human-caused increases in greenhouse gases. The
changes are inconsistent with explanations of climate change that rely
on known natural influences."
These results were strengthened by a more
recent 2018 report by
the International Panel on Climate Change.
-
In assessing the controversy, it's useful to remember that science is
as highly competitive a profession as you can find and that scientists
do not easily reach a consensus.
There are tremendous incentives for scientists to contravene the
"conventional wisdom," to be able to demonstrate convincingly that
their peers are misguided. That's how scientists become famous. No
one earns great credit for merely confirming what people already know.
The "models" for young scientists are the mavericks -- Galileo,
Darwin, Einstein, Feynman -- not the conformists. If scientists have
reached a consensus in the case of global warming, this means
that contrary evidence is unconvincing both in quality and
quantity.
Reading for this lecture:
-
Study Guide 19
Bennett textbook, Chapter 10.
-
Study Guide 20
Bennett textbook, Chapter 11
Web Links:
-
Atmospheric Evolution
-
Evolution
of Earth's Atmosphere (Brittanica)
Evolution of the Terrestrial Planet Atmospheres (Baines et al. 2013)
Ice Ages (Wikipedia)
Lecture on Ice Ages (J. Frogel, OSU)
Milankovitch Cycles (Wikipedia)
-
UK
Met Office Climate Dashboard
State of the Climate:
Global Analysis (monthly updates from NOAA)
The Discovery of Global Warming (Comprehensive history by S. Weart, American Institute of Physics)
Lorenz and the Butterfly Effect (Exploratorium)
Ozone Depletion (National Academies Press)
Responses to GW Critics (J. Cook)
A Global Warming Primer (J. Bennett, UCol)
Climate Science, Risk, & Solutions (Kerry Emanuel, MIT)
Climate Guide (UK MetOffice)
Climate Change (New Scientist site, articles & resources)
The Pentagon's Weather Nightmare. (There is some disturbing evidence that climate change can occur much more abruptly than is usually supposed. This article describes the implications of a possible "climate collapse.") National Research Council Report on "Climate Change Science" (2001)
Full text of the August 2013 statement from the American Geophysical Union
International Panel on Climate Change Synthesis Report (2014)
IPCC Special Report on Global Warming Above 1.5oC (2018) What We KNOW About Climate Change (video; lecture by MIT professor Kerry Emanuel)
Sea Level Rise Can No Longer Be Stopped. What Next? (video; lecture by UC Santa Cruz oceanographer John Englander)
 Previous Guide
|
 Guide Index
|
 Next Guide
|